
Solana price has gained more than 4% over the past 24 hours and has reclaimed $100, extending its seven-day rise to more than 17% as fresh ETF inflows and stronger network activity support demand for $SOL.
According to CoinGecko data, $SOL traded at $101.14 at the time of writing on Aug. 27 after reaching the $102 area during the latest move.
The token has risen from around $86 on Aug. 20, while its gains over the past 14 and 30 days stand at more than 32% and 38%.
Fresh demand from US spot Solana exchange-traded funds has provided one of the main catalysts.
The products recorded $9.14 million in net inflows on Aug. 26, with Morgan Stanley's MSOL accounting for $5.51 million and Bitwise's BSOL adding $2.65 million.
Cumulative net inflows across the products have reached roughly $1.26 billion. The latest additions followed $33.5 million of inflows on Aug. 24, the largest single-day total of 2026, when Bitwise's BSOL accounted for $25 million.
$SOL's move through $100 has occurred alongside a debate over changes that could reduce the token's future supply growth.
Two proposals under consideration by Solana validators seek to accelerate the reduction in new issuance and increase the amount of $SOL removed through transaction fee burns.
SGP-0002 proposes doubling the annual disinflation rate from 15% to 30%, which would allow Solana to reach its terminal inflation rate sooner.
SGP-0003 would change the network's fee structure and burn part of transaction fees permanently.
Estimates associated with the proposals put potential burns at around 7,500 to 9,000 $SOL per day, compared with around 650 $SOL under the current structure.
The proposed fee changes could lift daily $SOL burns as high as 9,000 tokens, while the faster disinflation schedule could bring the network to its 1.5% terminal inflation rate by 2029 instead of 2032.
Network usage has also increased while $SOL has recovered.
Solana Compass reported on Aug. 26 that the blockchain processed a record 4.2 billion non-vote transactions in July, up 13.5% from June and 91% from December 2025.
Average non-vote throughput reached 1,584 transactions per second during the month.
The same data showed tokenised real-world assets on Solana approaching $4 billion, while weekly non-vote transactions reached a record 1.318 billion during Aug. 17–23.
Solana's SIMD-0286 upgrade had also increased the mainnet block compute limit from 60 million to 100 million compute units in late July.
Institutional uses for $SOL have expanded alongside the increase in network activity.
Galaxy said on Aug. 25 that its new GalaxyOne Crypto Portfolio Line of Credit allows eligible clients to borrow against Bitcoin, Ether and $SOL, including staked $SOL, without selling the assets.
The revolving credit facility carries an 8.99% APR and no origination fee, with an initial loan-to-value ratio of 50%.
According to Galaxy, staked $SOL used as collateral can continue earning applicable staking rewards, while pledged assets are not rehypothecated.
$SOL price action
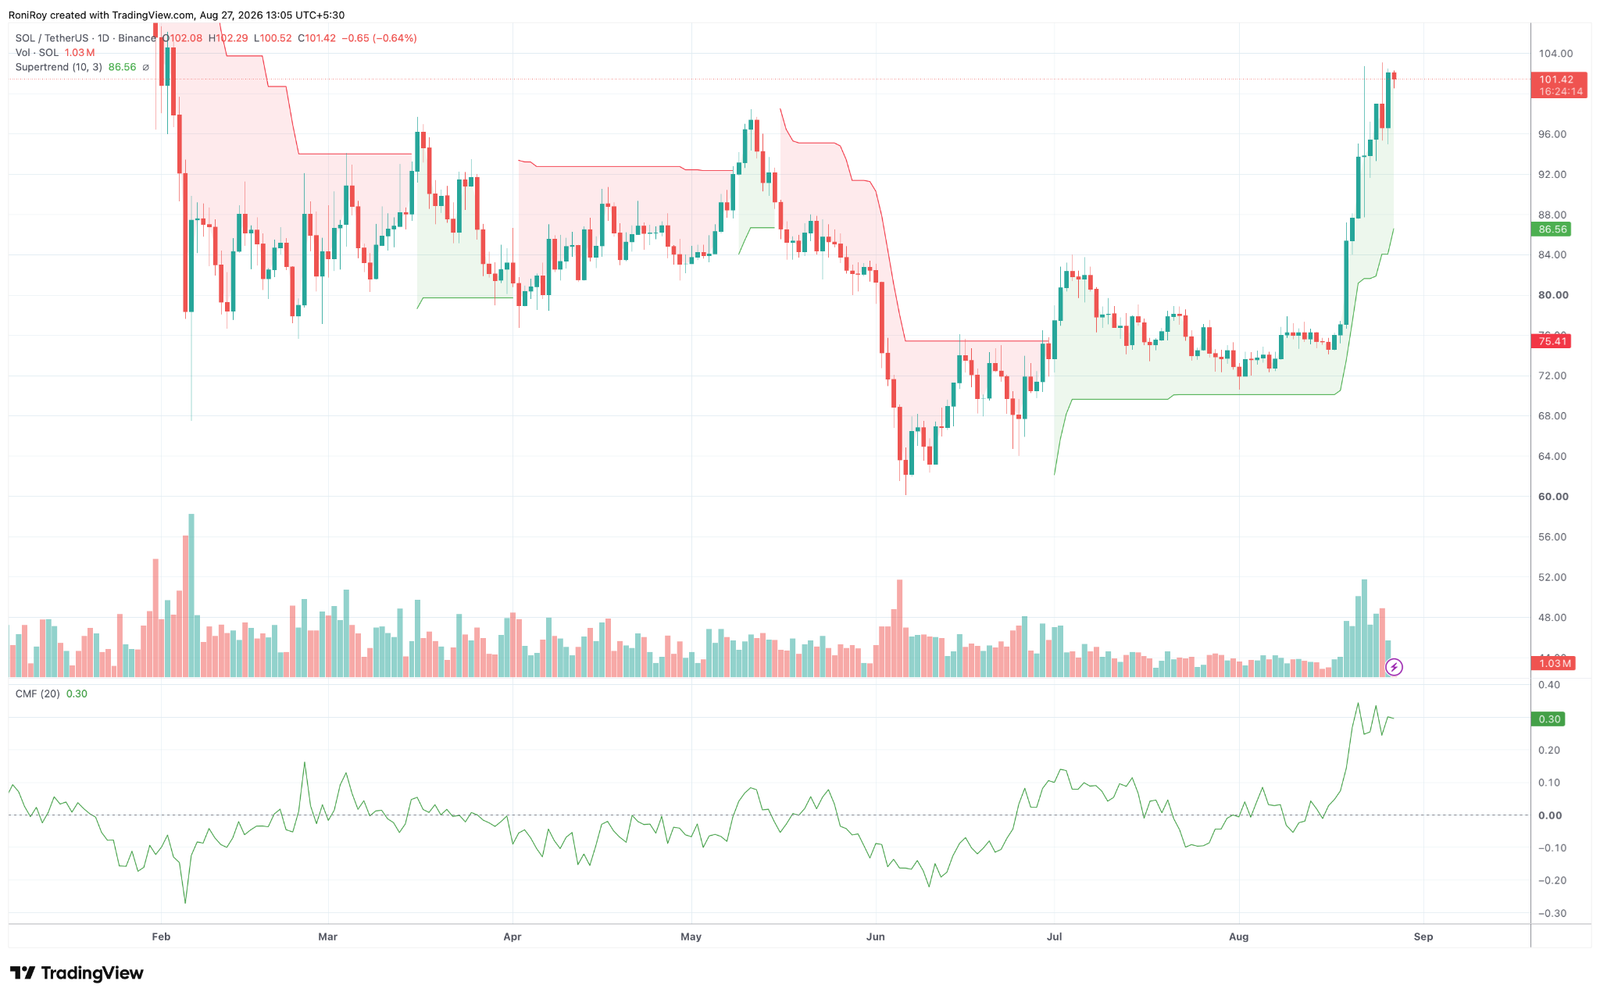
$SOL's daily chart shows the rally has changed the price structure after the token climbed from the low-$70 area earlier this month and broke through $100.
$SOL/$USDT 1-day price chart. Source: TradingView.
The daily Supertrend remains bullish, with its support line now at $86.56.
$SOL at around $101.42 is trading nearly 17% above that level, leaving the trend indicator firmly positive despite the steep rise over the past week.
Buying pressure has strengthened at the same time.
The 20-period Chaikin Money Flow has climbed to 0.30, well above its zero line, while trading volume expanded during the breakout from the mid-$70s towards $100.
The combination keeps $102–$104 as the first area $SOL needs to clear. Price has already tested this zone, but the daily candles have yet to establish a sustained move above it.
A breakout accompanied by continued positive money flow could put $108 in play, followed by the psychological $110 level.
A failure to clear $102–$104 would bring $100 back into focus.
Holding the former resistance as support would keep the breakout structure intact, while a move below it could expose the $96 area, where $SOL consolidated during the latest leg higher.
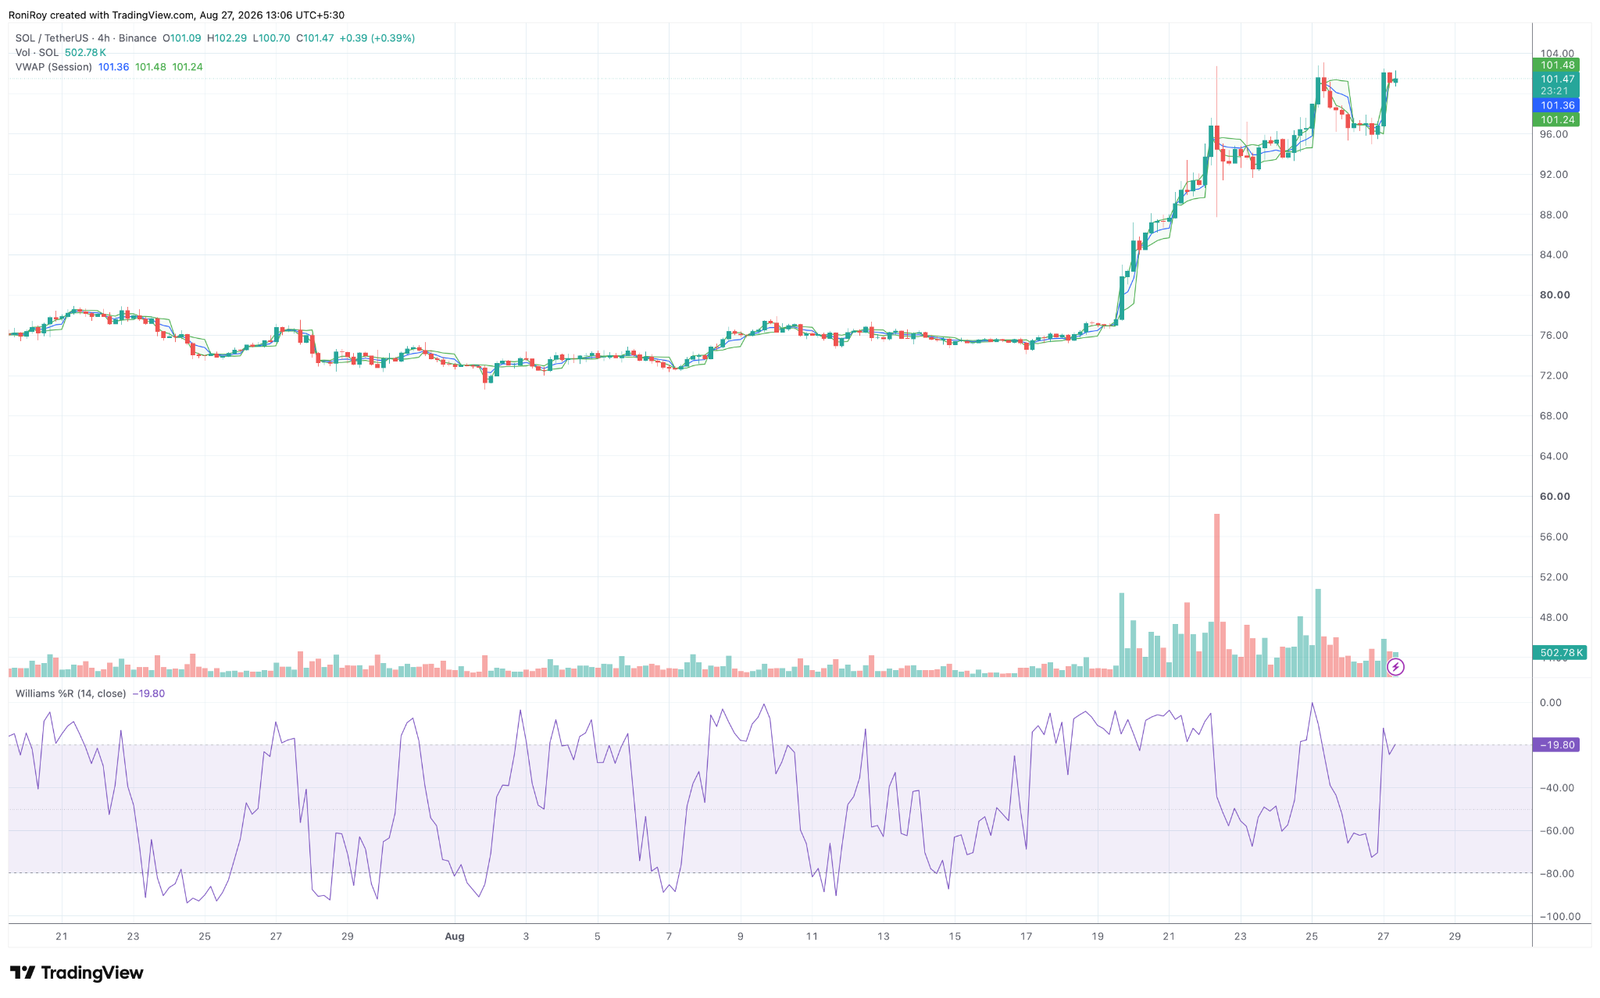
On the 4-hour chart, $SOL is trading almost directly around its session VWAP.
$SOL/$USDT 4-hour price chart. Source: TradingView.
Price stood near $101.47 against a VWAP reading around $101.36, leaving buyers and sellers closely balanced around the current level after the latest push higher.
Williams %R has simultaneously climbed to around -19.8 from readings near -70 during the Aug. 26 pullback.
The indicator is now at the edge of its overbought zone, showing that short-term momentum has recovered quickly as $SOL returned above $100.
A 4-hour close above $102–$104 would strengthen the case for another test higher, with $108 and $110 providing the next probable targets.
If momentum weakens while $SOL remains unable to clear $104, the VWAP area around $101 and the $100 level become the first supports to watch.
Below $100, the 4-hour structure leaves $96 as the next important support area.
A larger correction towards the daily Supertrend at $86.56 would require a much deeper reversal, with the indicator currently remaining well below $SOL's market price.