
SkyAI ($SKYAI) attracted renewed attention after posting a strong daily gain, despite remaining under intense pressure over the past week. The token climbed nearly 22% during the last 24 hours and traded around $0.03626 at the time of writing. However, the latest rebound followed a steep seven-day decline exceeding 61%, highlighting continued market uncertainty.
Daily trading volume reached more than $37 million, while the project’s market capitalization stood above $36.8 million. Consequently, traders continue watching whether the recent recovery marks the beginning of stabilization or simply another temporary bounce within a broader bearish trend.
$SKYAI Faces Strong Resistance Despite Oversold Momentum
The daily chart continues to favor sellers even after the latest price recovery. $SKYAI still trades beneath the 20, 50, 100, and 200-day exponential moving averages. This structure confirms that the broader market trend remains negative.
Moreover, the previous breakdown below the 50% Fibonacci retracement accelerated selling pressure. That decline pushed the token closer to the Fibonacci base near $0.0257. Although buyers recently defended lower prices, they still need stronger momentum before reversing the prevailing trend.
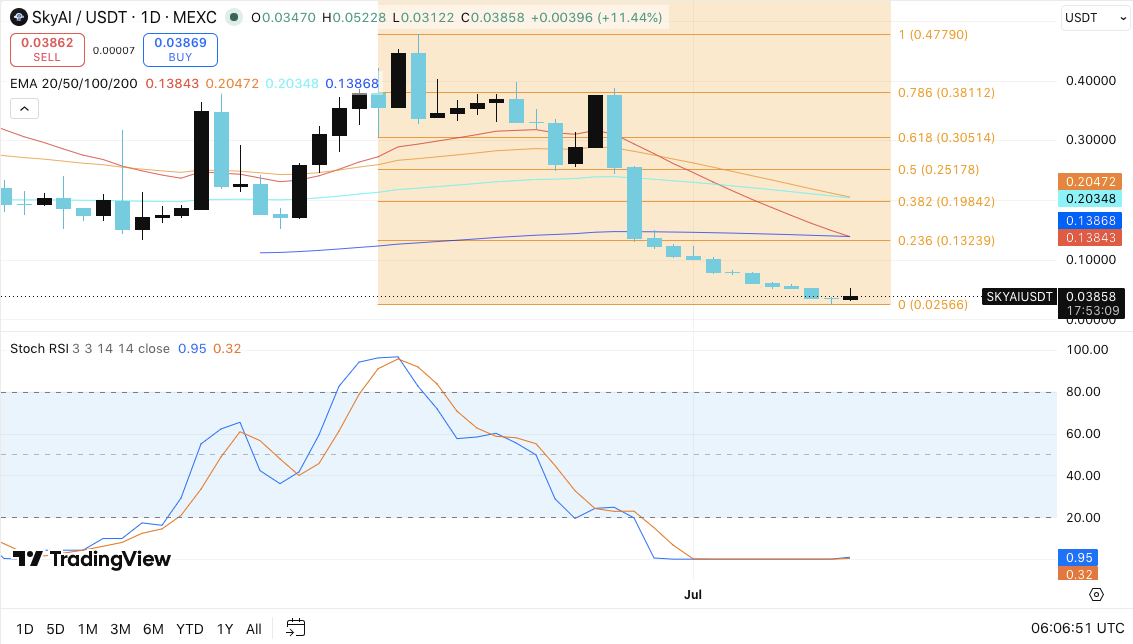
Additionally, the Stochastic RSI sits in deeply oversold territory. This condition suggests bearish momentum continues losing strength. Hence, a short-term rebound remains possible if buyers regain confidence. However, technical confirmation requires both higher oscillator readings and stronger price action above nearby resistance.
Immediate support stands near $0.0312. Meanwhile, the major downside protection remains around $0.0257. A decisive move below this level could trigger another wave of selling.
On the upside, resistance begins around $0.1324. The 200-day EMA near $0.1387 presents another significant challenge. Besides that, the $0.1984 to $0.2047 region forms a stronger resistance zone supported by the 50-day EMA and the 38.2% Fibonacci retracement.
Open Interest Declines as Traders Reduce Risk
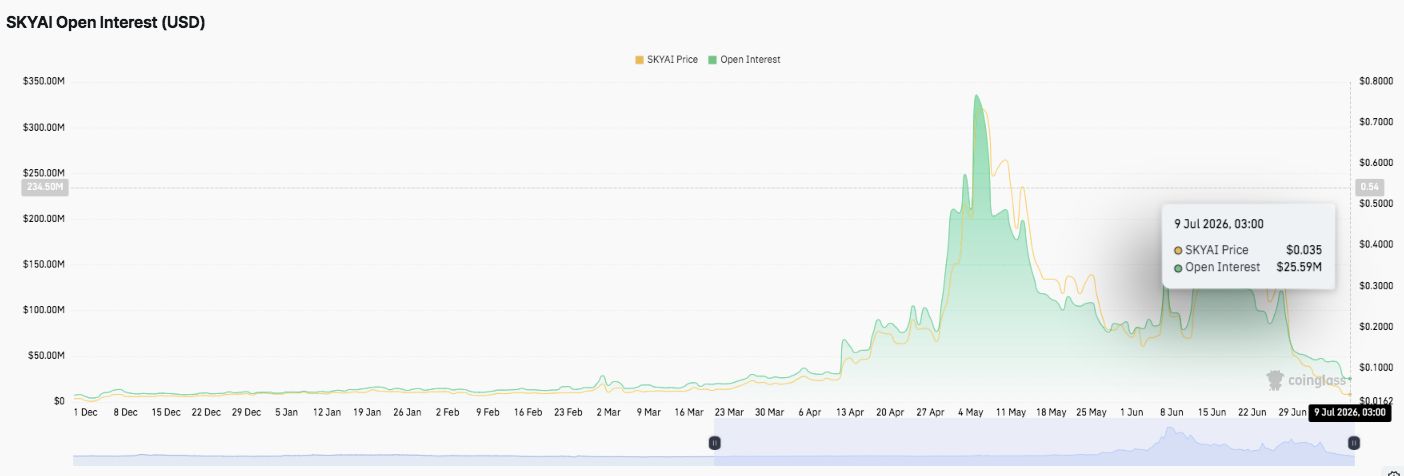
Derivative activity reflects a noticeable shift in market sentiment. Open interest stayed relatively quiet during the first quarter before expanding steadily throughout April. Growing participation suggested increasing confidence as prices advanced.
Significantly, leveraged positions surged during early May, lifting open interest above $300 million. However, that optimism quickly faded after heavy volatility forced traders to close positions. Consequently, open interest declined sharply over the following weeks.
By July 9, open interest had dropped to roughly $25.6 million. This decline indicates lower speculative exposure and a more cautious trading environment.
Spot Flows Signal a More Balanced Market
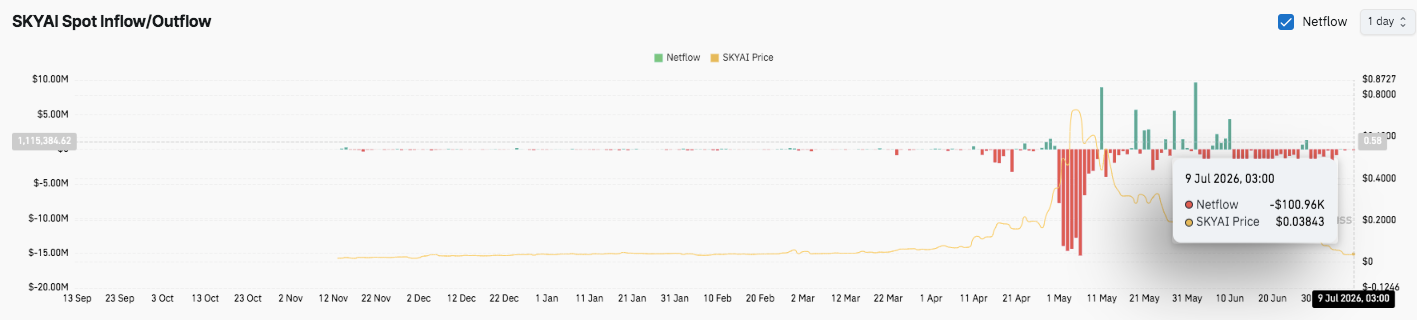
Spot market activity also reveals changing investor behavior. Heavy outflows dominated during $SKYAI’s price peak, reflecting widespread profit-taking. However, strong inflow periods later emerged as bargain hunters returned.
Moreover, inflows and outflows remained highly volatile throughout May and June, underscoring persistent uncertainty. Recent netflow data now appears relatively balanced. Consequently, the market may enter a consolidation phase while participants wait for a stronger catalyst before committing to the next major price direction.
Technical Outlook for SkyAI Price
Key technical levels remain critical as $SKYAI attempts to recover from its recent correction while trading within a broader bearish structure.
Upside levels: $0.1324 serves as the first major resistance, followed by the 200-day EMA at $0.1387. A sustained breakout above these levels could open the door toward the $0.1984–$0.2047 resistance zone, where the 38.2% Fibonacci retracement reinforces selling pressure.
Downside levels: Immediate support sits at $0.0312, while the major floor remains at the Fibonacci 0% level near $0.0257. Losing this support could accelerate downside momentum and expose the token to fresh record lows.
Resistance ceiling: The $0.1387 200-day EMA remains the most important technical barrier. Reclaiming this level would provide the first meaningful signal that buyers are regaining long-term control.
The broader chart still reflects a strong downtrend, with $SKYAI trading below all major exponential moving averages. However, the deeply oversold Stochastic RSI suggests selling momentum is weakening, increasing the possibility of a short-term relief rally if buyers step in.
Will SkyAI Go Up?
SkyAI’s near-term outlook depends on whether bulls can successfully defend the $0.0312 support while generating enough buying pressure to reclaim the $0.1324–$0.1387 resistance zone. Improving spot inflows and stabilizing open interest could strengthen recovery prospects and encourage renewed market participation.
Conversely, a breakdown below $0.0257 would reinforce the prevailing bearish trend and likely trigger another wave of selling. For now, $SKYAI remains in a stabilization phase, with price action, capital flows, and derivatives activity likely determining the next major directional move.