Shiba Inu ($SHIB) recorded a dramatic increase in on-chain activity over the past few days, with more transactions, higher trading volume, and larger exchange movements.
The surge points to a large-scale reshuffling of token supply rather than typical retail trading activity. Meanwhile, the spike comes as technical analysts remain cautious about $SHIB’s short-term price outlook.
Shiba Inu Network Comes Back to Life After Weeks of Low Activity
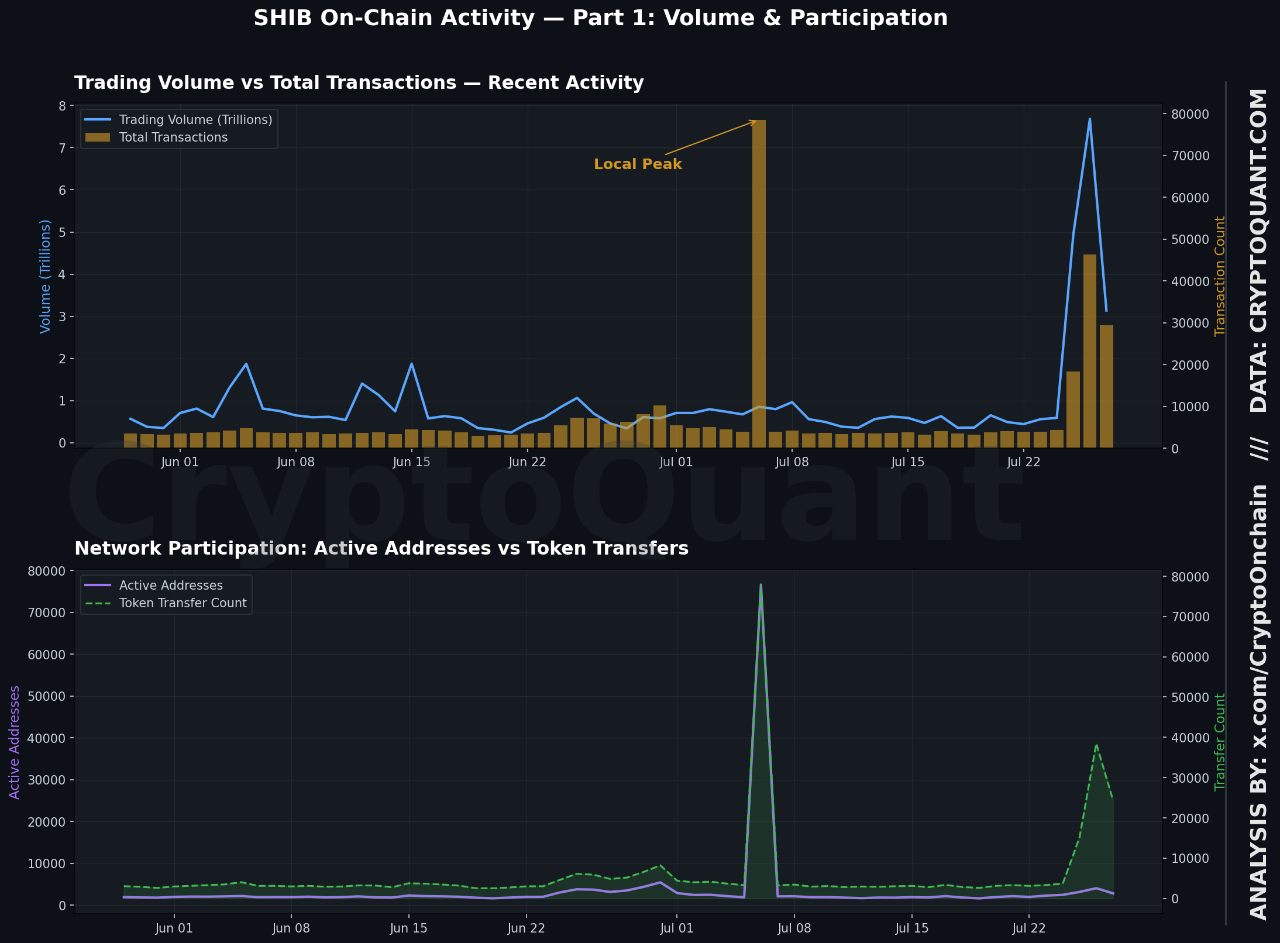
According to CryptoQuant on-chain data, Shiba Inu’s network activity remained relatively quiet for months before accelerating sharply between July 25 and July 26.
Network transactions jumped from around 3,600 on July 24 to more than 38,400 by July 26, representing a more than tenfold increase in activity.
During the same period, total trading volume rose by more than 384% compared with its seven-day average. Daily trading activity expanded from hundreds of billions of $SHIB tokens to trillions.
The simultaneous rise across multiple network metrics suggests a major shift in market participation.
Exchange Flows Signal Major Supply Redistribution
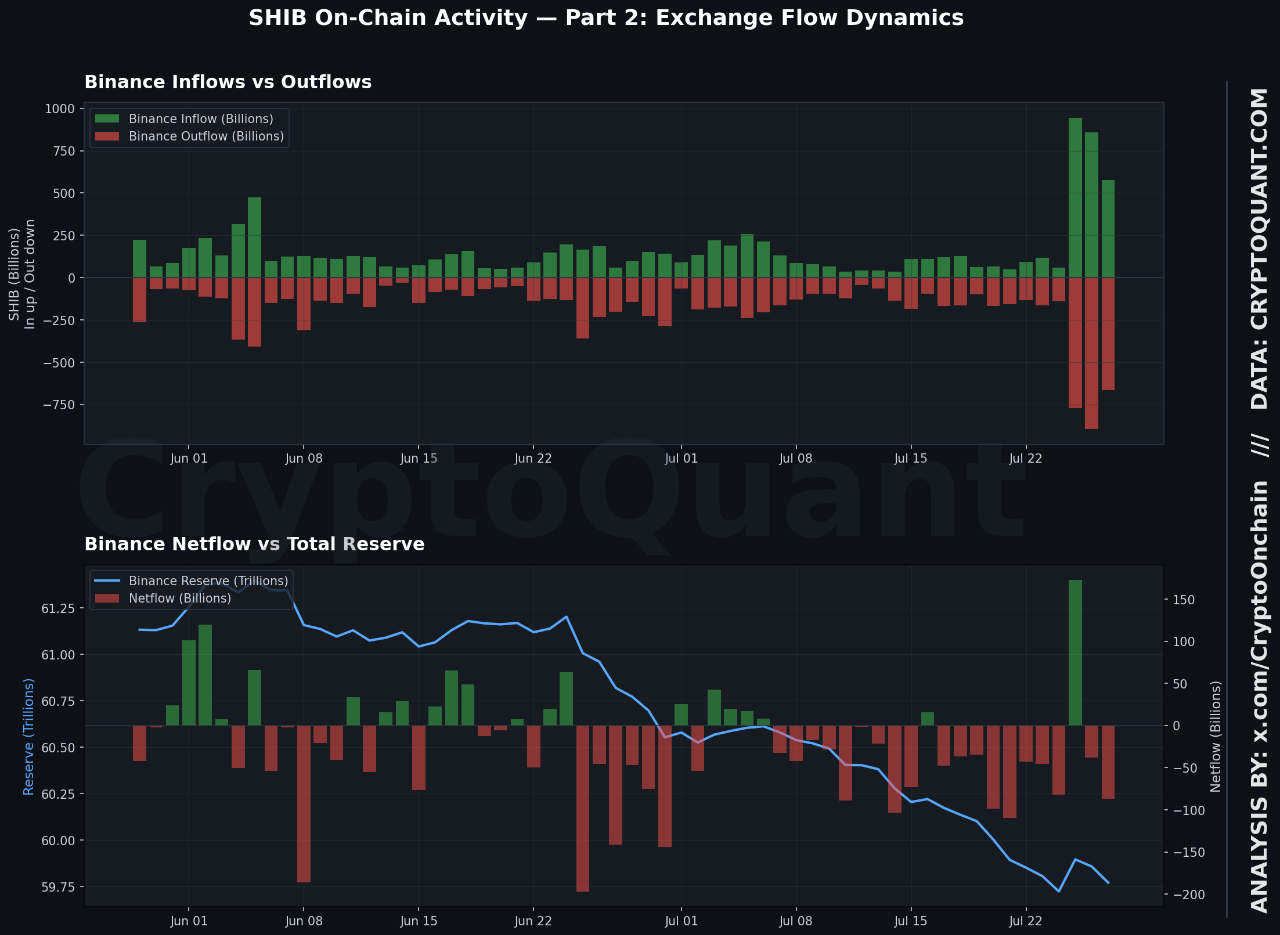
Meanwhile, one of the biggest developments came from Shiba Inu exchange flows. Exchange inflows surged 323% to roughly 943 billion tokens on July 25. Normally, such a move could signal rising selling pressure.
However, exchange outflows increased at nearly the same pace. Binance processed approximately 896 billion $SHIB in withdrawals by July 26.
The near balance between inflows and outflows suggests a rapid redistribution of supply across wallets rather than a simple wave of selling.
Large Holders Could Be Repositioning $SHIB Holdings
Transaction volume was not the only metric that increased. Active addresses also climbed 44%, showing increased participation across the network during the two-day surge.
The combination of higher transfer activity, increased wallet participation, and balanced exchange flows aligns with the behavior of institutional players, market makers, or large holders adjusting their positions. It appears less consistent with a typical retail buying or selling event.
The higher transfer volumes, more active wallets, and balanced exchange movements suggest that large holders, market makers, or institutions may have been moving funds around rather than regular traders buying or selling.
Where these tokens move next could help determine $SHIB’s future price direction. Historically, similar increases in network activity following quiet periods have often preceded significant price movements.
Technical Analyst Remains Bearish on $SHIB
Despite the rise in on-chain activity, TradingView analyst Sabri maintains a bearish outlook for $SHIB on the four-hour chart.
The analysis shows that $SHIB was rejected from the $0.0000057621 resistance zone, which continues to act as a major supply area.
The token has also fallen below the key $0.0000048764 level, and sellers are likely to remain in control as long as $SHIB trades below this threshold.
The analyst identifies the next major demand zone near $0.0000025509. A move to that level would represent a potential decline of roughly 45% if current support fails.
Under this scenario, $SHIB’s bearish structure would remain intact until the price closes back above $0.0000048764. A four-hour close above $0.0000057621 would invalidate the bearish setup and shift momentum back toward buyers.
At press time, Shiba Inu is trading at $0.000004640, up 11.5% over the past week.