
Shiba Inu continues to follow a well-defined downtrend pattern, with the latest price action reinforcing the broader bearish structure.
The Shiba Inu ($SHIB) chart shows sellers maintaining control through a series of lower highs, while each recovery attempt has not been sustainable.
A long-term descending trendline early capped rallies for months, and the recent move fits the same pattern. After slipping below support, $SHIB has repeatedly attempted to rebound, but its price has stalled around key resistance zones, raising the possibility of deeper corrections.
Shiba Inu Recovery Attempts Continue to Lose Momentum
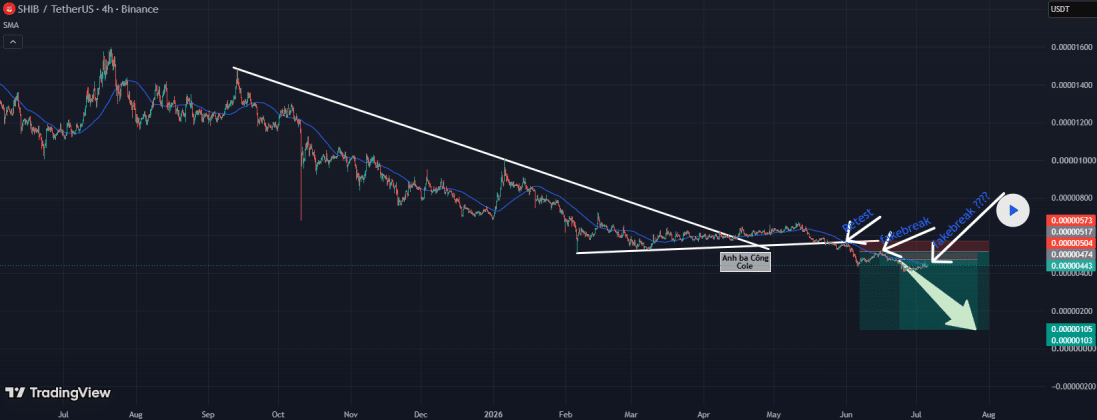
Shiba Inu trailed beneath a descending trendline between September 2025 and April 2026, consistently making lower highs and lower lows. After breaking out, it made a series of higher lows along an ascending trendline before breaking below it in May. This confirmed the bearish bias.
The $SHIB/USDT 4H chart highlights a familiar sequence that repeated throughout the decline. A brief rebound has followed each sharp sell-off, only for earlier gains to be wiped out as the retested resistance attracts fresh selling pressure.
Shiba Inu confirmed this in the early June retest, where its price peaked near $0.00000558. What followed was a sharp decline to a new low of $0.00000430 five days later. Another fakeout happened with a brief rally to $0.00000520 on June 15. Bears regained control and dragged $SHIB lower.
$SHIB Downward Structure Intact
Meanwhile, the latest market bounce has carried $SHIB back toward the former support area near $0.0000046. The meme coin stalled near the resistance area, which aligned closely with the 100-period moving average. Notably, the loss of momentum there is critical as the dynamic resistance has repeatedly rejected earlier recoveries.
The latest rejection means the overall market structure has not changed. The sequence of lower highs and lower lows remains intact, while repeated failures near resistance indicate that buyers have yet to establish sustained control.
As long as $SHIB remains below the 100 MA and the nearby resistance zone around $0.0000046, the broader bias continues to favor the downside. The downside target is a potential decline toward the next support region near $0.0000010, a 77% crash from the current price level.
However, a successful reclaim of the resistance could open the door to a stronger recovery. A decisive move above resistance, supported by sustained buying pressure, would weaken this outlook.
Could $SHIB Accumulation Disrupt Bears?
While price analysis shows a bearish outlook, on-chain data provides a glimmer of hope. Specifically, Shiba Inu whales are accumulating Shiba Inu through weakness, suggesting confidence in the asset’s price trajectory.
In the past 24 hours, the total exchange netflows have turned negative, highlighting that coins that flowed out surpassed those that entered. The metric increased by 1.43% to a negative 33.5 billion $SHIB tokens, worth $146,207.
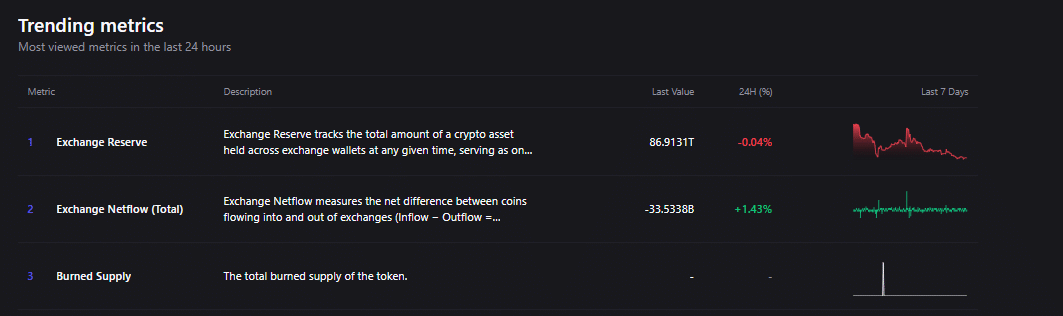
Notably, with the negative flow, total exchange reserve dropped slightly to 86.9 trillion. Fewer tokens of these platforms reduce selling pressure. It also means more of $SHIB’s supply is in wallets more likely to hold longer. Whether this accumulation disrupts the bearish trend remains to be seen.