
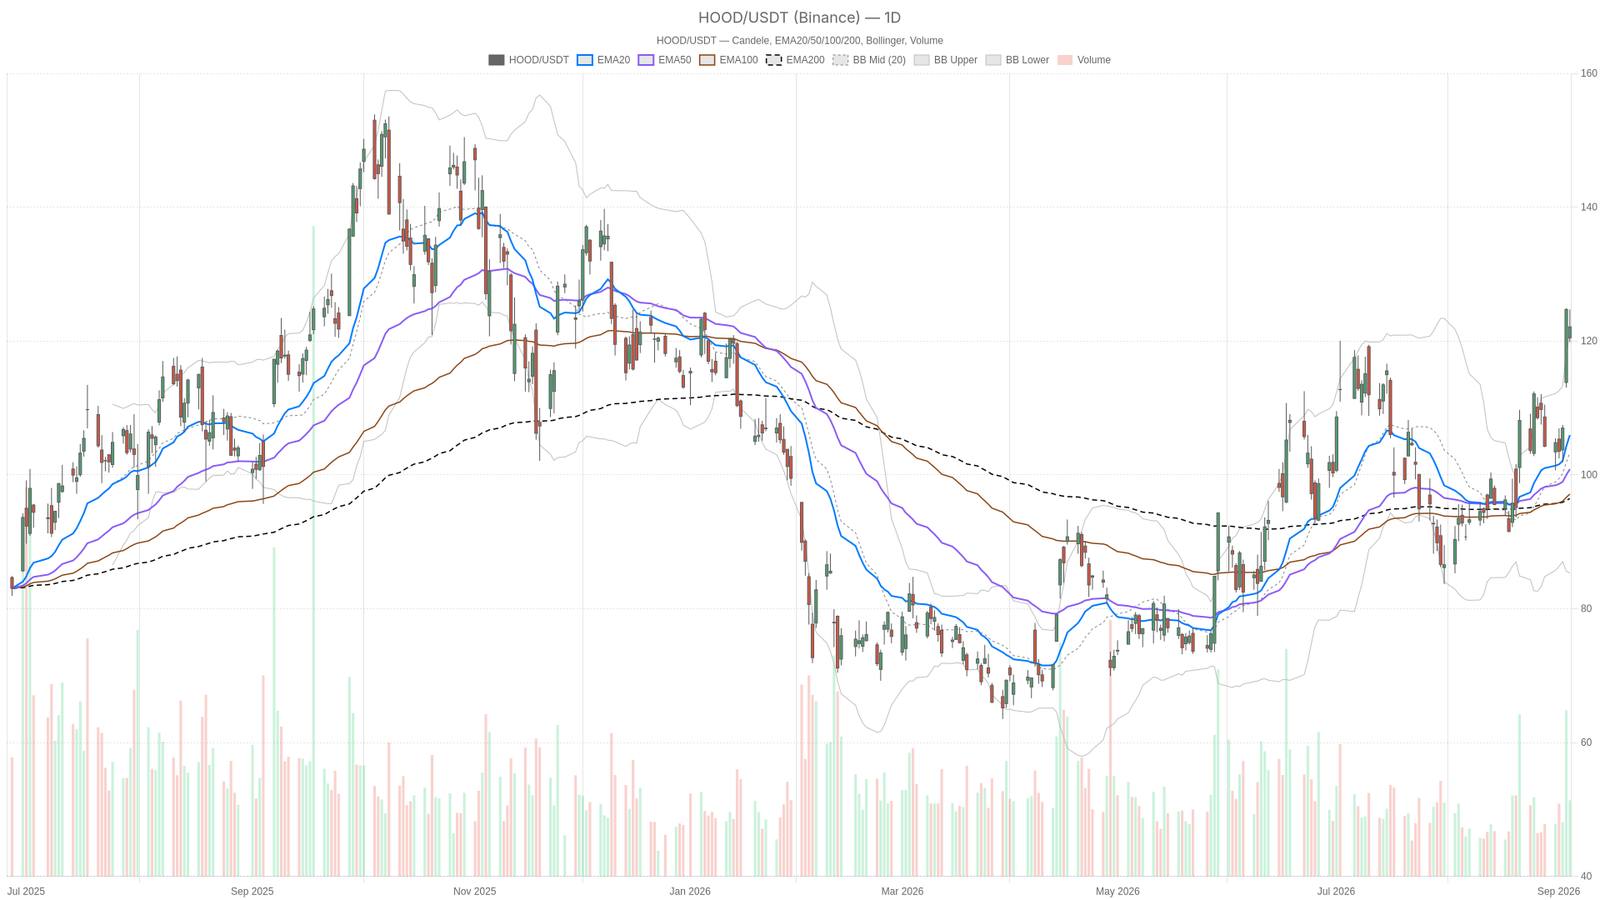
Robinhood stock remains in a firm daily uptrend, but the rally is showing fatigue near resistance. HOOD closed September 4 at 122.11, just below its 122.21 pivot, after tagging 124.7. The broader structure still favors buyers, yet the next move could prove decisive.
Key takeaways
- Robinhood stock is in a confirmed daily uptrend with all EMAs bullishly stacked above one another.
- HOOD closed at 122.11, trading slightly above the daily upper Bollinger Band at 121.26.
- Hourly MACD shows early momentum divergence despite the bullish daily structure.
- Daily support sits at 119.72; a break below would mark the first technical crack in the uptrend.
- ATR14 at 7.38 confirms elevated volatility, supporting wide daily swings in either direction.
Daily Structure: Robinhood Stock Shows Strong Trend but Stretched Price
The daily chart for Robinhood stock is unambiguously bullish. However, price is now stretched above the upper Bollinger Band at 121.26, which raises the odds of a near-term pause or mean-reversion move.
EMA Stack Confirms the Trend
The EMA stack is fully aligned in textbook trending fashion. The 20-period EMA at 105.95 sits above the 50-period at 100.85. In turn, the 50-period sits above the 200-period at 96.45. That kind of separation confirms momentum has been building steadily rather than spiking on a single catalyst.
Momentum Indicators and Bollinger Caution
RSI14 at 65.94 reinforces the bullish picture. It is strong without being extreme, leaving room before classic overbought territory kicks in. Meanwhile, MACD tells a similar story: the line sits at 4.92 against a signal of 2.77, producing a histogram of 2.16. That positive and expanding histogram signals that bullish momentum has not yet started fading on this timeframe.
However, the Bollinger Bands add a note of caution. With the upper band at 121.26 and price closing at 122.11, HOOD is trading slightly above the upper band. That is an extended condition. It does not invalidate the uptrend, but it raises the odds of a pause. A mean-reversion move back toward the 103.3 Bollinger midline remains possible before the next leg higher. ATR14 at 7.38 confirms this is a genuinely volatile name, with daily ranges wide enough to produce meaningful swings in either direction.
1H Timeframe: Confirmation With a Warning Sign
The hourly chart confirms the bullish regime for Robinhood stock, but it also flashes an early momentum divergence signal. Short-term momentum is beginning to lose steam even as the daily trend stays intact.
EMA and RSI Alignment
The hourly EMA stack mirrors the daily setup. EMA20 at 118.79, EMA50 at 112.99, and EMA200 at 104.72 are all aligned bullishly. RSI14 at 67.32 shows momentum is still running hot on this timeframe as well.
MACD Divergence Tightens the Range
Notably, the MACD on the 1H chart tells a slightly different story than the daily. The line at 4.17 is now just below the signal at 4.26, producing a small negative histogram of -0.09. That is a subtle but real divergence. Price is also sitting almost exactly on the hourly pivot of 122.34. Resistance sits at just 122.84 and support at 121.57. This tight range reflects indecision after the recent push higher.
This is where the conflict between timeframes becomes relevant. The daily chart says the trend is healthy and momentum is expanding. The hourly chart says short-term momentum is stalling right at a key pivot. Neither signal is alarming on its own. Together, however, they suggest the market is digesting recent gains rather than confidently pressing higher in the immediate term.
15-Minute View: Consolidation, Not Conviction
Zooming into the 15-minute chart confirms that near-term price action has turned neutral for HOOD. Buyers have paused after the recent thrust into resistance, and the setup alone should not be used to call the broader trend.
RSI14 sits at 45.44, essentially in no-man’s land. Meanwhile, the MACD histogram has slipped to -0.26, with the line at 0.17 below the 0.43 signal. That reflects a short-term bearish tilt. Price is hovering near the lower Bollinger Band at 122.04 rather than the mid or upper bands. EMA20 at 122.82 sits just above spot price. In practical terms, this timeframe is best read as execution context: HOOD is coiling in a tight range just below its recent highs.
What Would Support the Bullish Case
For the bullish scenario to reassert itself, Robinhood stock would need to hold above daily support at 119.72. It must then reclaim the 124.6 resistance level with conviction. A recovery in the hourly MACD histogram back into positive territory would help confirm that intraday momentum is realigning with the daily trend.
On the fundamental side, sentiment has been mixed but not uniformly negative. Cathie Wood reportedly bought Robinhood shares even amid controversy over the company’s tokenized stock offerings. Separate coverage has highlighted strong attention around the blockchain ecosystem tied to Robinhood, including a sharp rally in a related altcoin. That kind of continued interest in Robinhood’s blockchain initiatives could keep speculative buying interest alive, even as the stock digests its recent gains.
What Would Invalidate the Uptrend
A decisive break below the 119.72 daily support level would be the first real technical crack in this uptrend for Robinhood stock. Given the daily Bollinger Band extension and the momentum divergence already visible on the 1H chart, a deeper pullback is not out of the question. Price could retreat toward the 105.95 EMA20 or even the 103.3 Bollinger midline if buyers fail to defend current levels.
Meanwhile, the news backdrop carries genuine headline risk. Coverage questioning whether Webull might be the better buy compared to Robinhood adds a layer of narrative uncertainty. Ongoing criticism of Robinhood’s tokenized stock offerings feeds into the same sentiment risk. Neither story changes the technical picture directly. Both, however, could accelerate any pullback if technical support levels give way.
Closing Take
Overall, the dominant signal for Robinhood stock remains bullish. The daily trend, the EMA structure, and the MACD histogram all point in the same direction. At the same time, the hourly and 15-minute charts are flagging short-term exhaustion right into resistance. The stretched Bollinger Band condition on the daily chart adds to the case for consolidation before the next directional move. With elevated volatility confirmed by ATR readings and news flow still evolving around Robinhood’s blockchain ambitions and competitive positioning, positioning around current levels calls for discipline rather than conviction in either direction.
FAQ
What is the current trend for Robinhood stock?
The daily trend is firmly bullish. The EMA stack is fully aligned, with the 20-period EMA at 105.95 above the 50-period at 100.85 and the 200-period at 96.45. RSI14 at 65.94 and a positive, expanding MACD histogram both confirm that bullish momentum remains intact on the daily timeframe.
What are the key support and resistance levels for HOOD?
Key daily support sits at 119.72. On the hourly chart, support is tighter at 121.57. Resistance on the daily timeframe stands at 124.6, while hourly resistance is at 122.84, just above the pivot of 122.34. The Bollinger Band midline at 103.3 also represents a deeper support zone if a pullback materializes.
Is a pullback likely in Robinhood stock?
A pause or pullback is a realistic near-term risk. HOOD is trading slightly above the daily upper Bollinger Band at 121.26, which signals an extended condition. Meanwhile, the hourly MACD has flipped to a small negative histogram of -0.09, indicating short-term momentum is beginning to fade even as the broader trend holds.
What does the MACD divergence on the hourly chart mean?
The hourly MACD line at 4.17 has slipped below its signal line at 4.26, producing a negative histogram of -0.09. This subtle divergence means intraday momentum is losing steam, even though the daily MACD remains positive and expanding. It does not invalidate the uptrend, but it suggests the market is digesting recent gains rather than pressing higher in the immediate term.
Disclaimer: This article is for informational purposes only and does not constitute financial advice, an investment recommendation, or a solicitation to buy or sell any financial instrument or cryptocurrency. The analysis provided is not indicative of future results. Investing in crypto assets and financial markets carries a high risk of capital loss. Always do your own research (DYOR) and consult a qualified financial advisor before making any decision.
Article produced with the assistance of artificial intelligence and reviewed by the editorial team.