
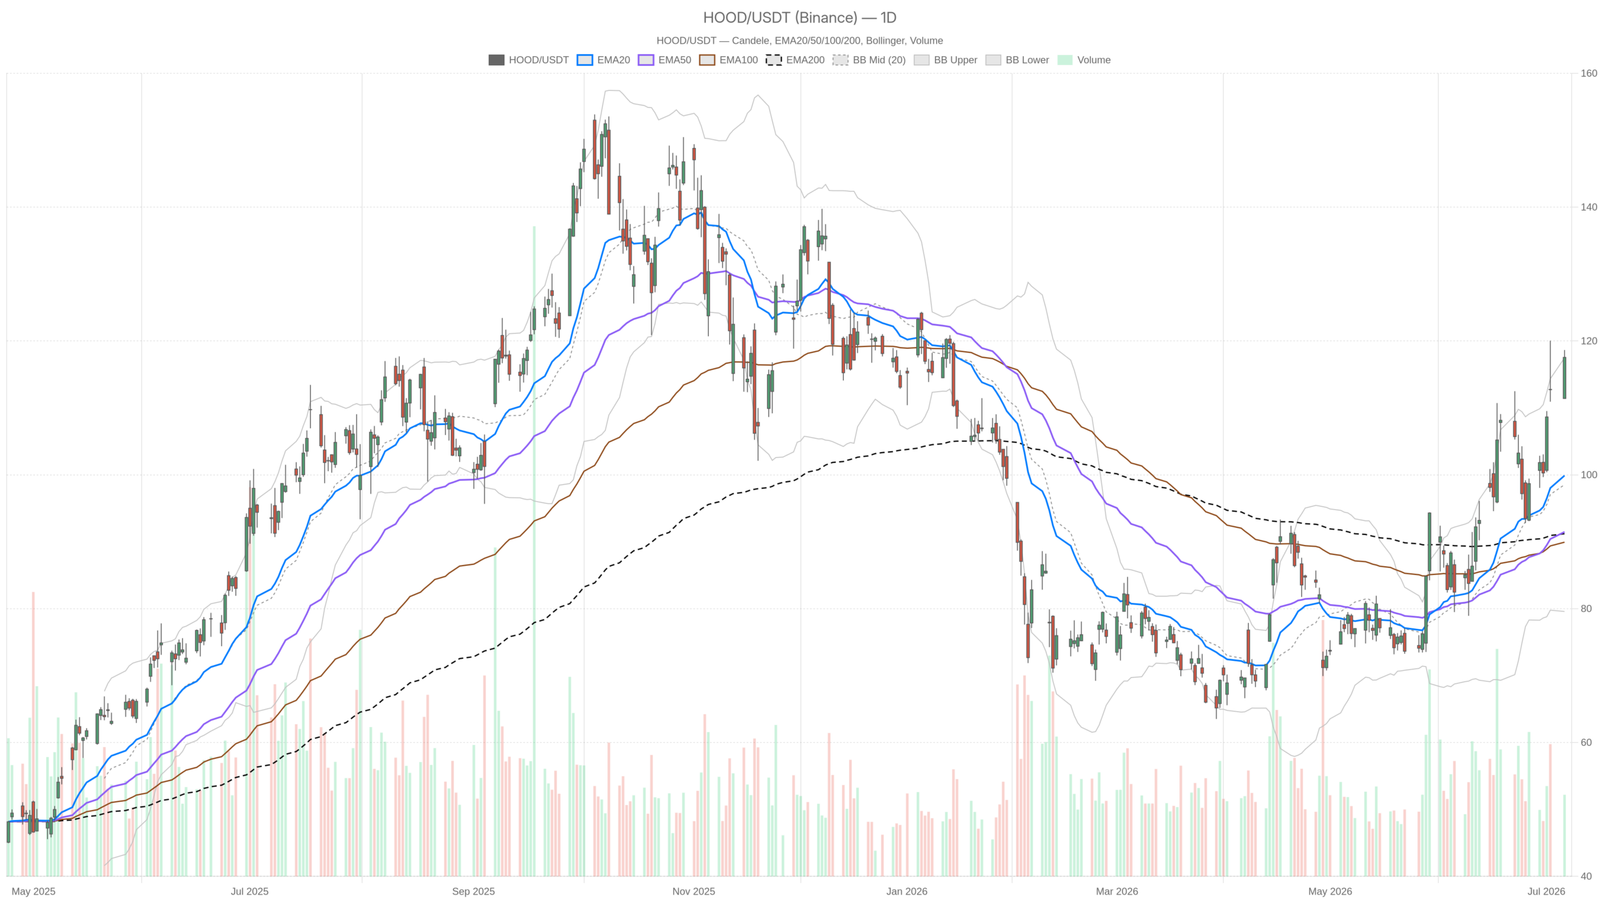
Robinhood Stock surged to $117.55 on July 6, gaining over $6 from its open of $111.41 to touch $118.65 intraday. The daily structure is unambiguously bullish. Yet with RSI nearing 70 and price above the upper Bollinger Band, the real question is whether momentum can hold into Q2 earnings.
Key takeaways
- HOOD closed at $117.55 on July 6, surging from $111.41 to an intraday high of $118.65 on volume of 25.39 million shares.
- Daily RSI sits at 69.87, approaching overbought territory, while price has breached the upper Bollinger Band at $117.48.
- All three daily EMAs — EMA20 at $99.89, EMA50 at $91.47, and EMA200 at $91.20 — remain bullishly stacked beneath price.
- Daily pivot resistance sits at $120.33 (R1), with support at $113.09 (S1); daily ATR stands at $7.47.
- Q2 earnings are expected to show a double-digit decline, creating fundamental risk against a backdrop of strong product catalysts from the London keynote.
Daily Bias — Robinhood Stock Is Firmly Bullish but Extended
Robinhood Stock is trading in a firmly bullish daily structure. Price at $117.55 sits well above the EMA20 at $99.89, EMA50 at $91.47, and EMA200 at $91.20. However, RSI at 69.87 and a close above the upper Bollinger Band at $117.48 signal the rally is overextended.
HOOD trades at a commanding premium to all three exponential moving averages, which remain stacked bullishly. That kind of separation typically reflects strong institutional participation, not noise.
The MACD line sits at 6.80 against a signal of 5.57, with a positive histogram of 1.23. Momentum is expanding, not contracting. Meanwhile, the RSI at 69.87 is knocking on the door of classic overbought territory. It has not crossed 70 yet on the daily, but it is close enough to warrant attention.
Bollinger Band Breach and Pivot Structure
The upper Bollinger Band sits at $117.48, and the July 6 close of $117.55 effectively prints above it. That band breach historically signals extreme strength. However, it also creates a context where mean-reversion pressure can build. The mid-band at $98.53 represents a gravitational pull if the rally stalls. Daily ATR at $7.47 confirms this is not a low-volatility environment.
Pivot analysis places the daily pivot point at $115.87, with R1 at $120.33 and S1 at $113.09. HOOD closed above its PP on strong volume of 25.39 million shares. The next upside reference is $120.33. Below, $113.09 is the first meaningful support worth monitoring.
Hourly Confirmation — Strength Remains Intact but Momentum Is Thinning
Robinhood Stock maintains a clean bullish structure on the 1-hour chart. Price closed the 15:30 session at $117.59, comfortably above the H1 EMA20 at $112.89, EMA50 at $107.57, and EMA200 at $96.34. The trend across all three moving averages holds firmly.
However, the hourly RSI at 71.16 has already crossed into overbought territory — a step further than the daily. Meanwhile, the MACD histogram at 0.20 remains positive, but it has clearly thinned relative to prior readings. Hourly momentum is alive, yet it is losing its punch. That divergence between a strong daily and a thinning hourly is a key nuance.
The H1 Bollinger upper band sits at $120.21, leaving roughly $2.60 of room before price tests that ceiling. The pivot framework on the hourly is tight: PP at $117.83, R1 at $118.34, S1 at $117.07. HOOD oscillates within a narrow $1.27 range at the highs. That compression at the top of a move deserves respect.
15-Minute Context — Micro Exhaustion Starting to Show
At the execution level, Robinhood Stock is showing early signs of micro exhaustion. The 15-minute RSI has pulled back to 59.72, no longer stretched, while the MACD histogram has flipped marginally negative at -0.05. Short-term momentum has clearly cooled after the intraday push to $118.65.
Price closed at $117.59, sitting just above the 15m EMA20 at $116.79. That is still constructive. The 15m Bollinger bands are tight — upper at $118.58, lower at $115.81 — and ATR at $0.73 reflects compressed short-term volatility. The market is consolidating near the highs. A clean break above $118.15 (15m R1) would re-energize short-term buyers. A slip below $117.17 (15m S1) could trigger a quick test of the $116–$116.80 zone.
Fundamental Catalysts Fueling the Robinhood Stock Rally
Robinhood Stock did not move on technicals alone. A 4.6% jump in the afternoon session on July 7 was attributed to consumer confidence edging up to 91.2 in June. That macro tailwind directly benefits a retail-facing brokerage. More structurally, the London keynote laid out an ambitious global expansion roadmap. It covered Robinhood Chain, stock tokenization, DeFi lending, perpetual futures, and AI-powered trading.
On the crypto-yield side, Robinhood launched Earn, offering users up to 7% APY on $USDG through DeFi lending via Morpho markets. This product reaches 27.7 million customers. It represents a meaningful step toward monetizing idle balances. These are not incremental announcements — they signal a company repositioning across multiple high-growth verticals simultaneously.
In contrast, the Q2 2026 earnings picture introduces a real overhang. Analysts expect a double-digit decline in earnings when results are released later this month. That is a meaningful fundamental risk sitting directly in the path of this rally.
Bullish Scenario — Breaking $120 and Sustaining the Move
For the bull case to extend, Robinhood Stock needs to clear daily R1 at $120.33 with conviction. A daily close above that level would break above both the upper Bollinger Band and the next pivot resistance simultaneously. That would signal the rally has room toward the $125–$128 area.
Supporting this scenario: positive MACD momentum on the daily, all EMAs in bullish alignment, and a wave of product catalysts from the London keynote. If Q2 earnings surprise to the upside — or if guidance offsets the expected decline — that could be the accelerant the stock needs to sustain its advance.
Bearish Scenario — Earnings Risk and Overbought Exhaustion
The bearish case for Robinhood Stock is equally coherent. Daily RSI at 69.87 and a close above the Bollinger upper band at $117.48 are textbook conditions for a pullback. If HOOD fails to hold above the daily pivot at $115.87, selling momentum could carry the stock toward S1 at $113.09. A breach of $113 would open the door to a deeper retracement toward $107–$108, where the H1 EMA50 currently sits.
The most credible near-term risk remains the Q2 earnings release. A double-digit earnings decline, if confirmed without strong guidance, could puncture the current narrative around HOOD’s expansion story. At these price levels, the market has priced in significant optimism — leaving it exposed to disappointment.
Positioning Around an Overextended Robinhood Stock Rally
Robinhood Stock is in a technically strong but overextended position. The daily regime is bullish, the macro backdrop improved, and the product pipeline is genuinely compelling. At the same time, RSI is pressing against 70, price has breached the upper Bollinger Band, and Q2 earnings risk is real and imminent.
Traders chasing the move here face an asymmetric setup. There is limited room to run before the next resistance at $120.33, and a credible catalyst exists for a sharp reversal. A more prudent approach is to wait for either a confirmed breakout above $120.33 or a constructive pullback to the $113–$115 range before reassessing risk. Volatility at $7.47 daily ATR means both scenarios can materialize quickly.
FAQ
Is Robinhood Stock overbought right now?
On the daily timeframe, RSI sits at 69.87 — just below the classic 70 overbought threshold — while price has closed above the upper Bollinger Band at $117.48. On the hourly chart, RSI has already crossed into overbought territory at 71.16, suggesting short-term extension. The stock is not yet deeply overbought on the daily, but it is clearly stretched.
What are the key levels to watch for Robinhood Stock?
The critical upside level is daily R1 at $120.33. A confirmed breakout above that could open the path toward $125–$128. On the downside, the daily pivot at $115.87 is the first line of defense, followed by S1 at $113.09. A breach below $113 would expose the $107–$108 zone, where the hourly EMA50 currently sits.
What fundamental catalysts are driving HOOD higher?
Consumer confidence improved to 91.2 in June, providing a macro tailwind for the retail brokerage. More significantly, Robinhood’s London keynote outlined an ambitious roadmap including Robinhood Chain, stock tokenization, DeFi lending, perpetual futures, and AI-powered trading. The launch of Earn, offering up to 7% APY on $USDG to 27.7 million customers, adds a concrete monetization catalyst.
What is the biggest risk facing Robinhood Stock right now?
The Q2 2026 earnings release, expected later this month, represents the most immediate risk. Analysts anticipate a double-digit earnings decline. If confirmed without strong forward guidance, the result could puncture the optimism currently priced into HOOD shares at these elevated levels.
Disclaimer: This article is for informational purposes only and does not constitute financial advice, an investment recommendation, or a solicitation to buy or sell any financial instrument or cryptocurrency. The analysis provided is not indicative of future results. Investing in crypto assets and financial markets carries a high risk of capital loss. Always do your own research (DYOR) and consult a qualified financial advisor before making any decision.
Article produced with the assistance of artificial intelligence and reviewed by the editorial team.