
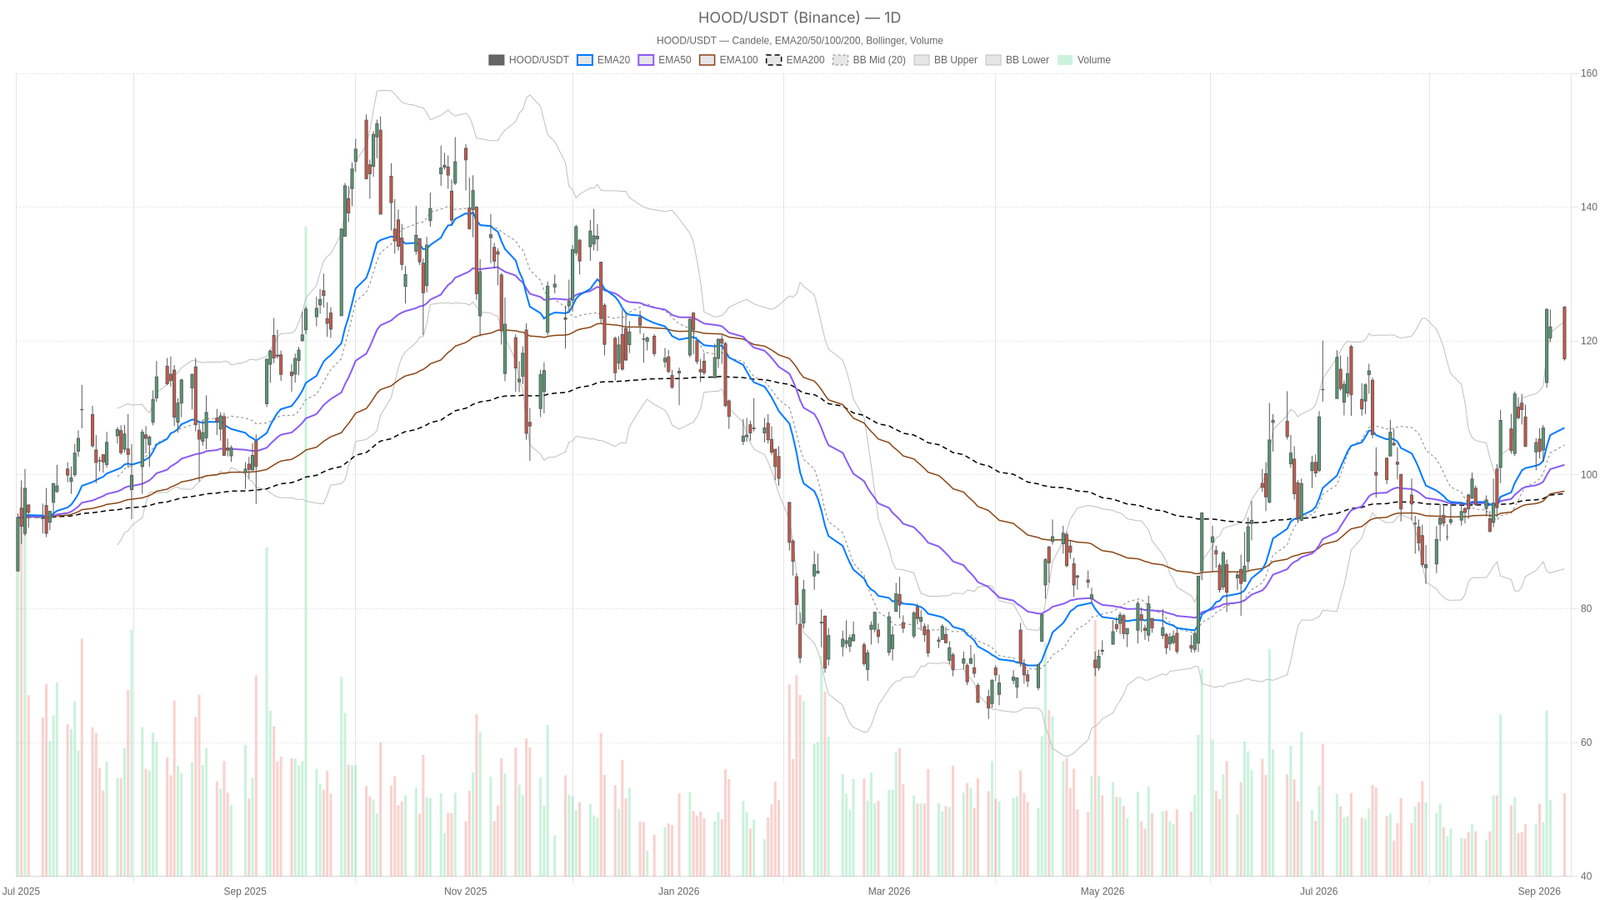
Robinhood stock just suffered one of its sharpest single-session reversals in weeks. HOOD opened at $125.07, briefly touched $125.22, then collapsed to close at $117.34 on September 8. The nearly eight-dollar swing reshapes the near-term conversation, even as the daily structure remains constructive.
Key takeaways
- Robinhood stock plunged nearly $8 from high to close on September 8, settling at $117.34.
- The daily trend remains structurally bullish, with price above EMA20, EMA50, and EMA200.
- Hourly momentum has deteriorated, with MACD posting a fresh bearish crossover.
- The 15-minute RSI at 22.60 signals deeply oversold conditions, suggesting a potential technical bounce.
- S1 support at $114.54 is the critical level to watch in the coming sessions.
Daily Structure: Robinhood Stock Trend Stays Bullish Despite Cooling Momentum
The daily trend for Robinhood stock remains structurally bullish, with price holding above all three key moving averages.
Moving Average Alignment Supports Buyers
Price sits above the EMA20 at $107.03, the EMA50 at $101.49, and the EMA200 at $97.18. That stacked alignment forms a textbook bullish structure, and the daily regime reading itself remains classified as bullish.
On the momentum side, RSI14 on the daily timeframe stands at 60.77, comfortably above the neutral 50 line. This confirms buyers still control the broader tape. However, the reading is down from more overbought territory, signaling this pullback is real and not just noise.
Momentum Indicators Signal a Pause
Meanwhile, MACD on the daily remains net positive, with the line at 5.19 against a signal of 3.25 and a histogram of 1.94. Momentum is still tilted bullish overall. Still, the size of Monday’s reversal candle is the kind of price action that tends to precede a short consolidation phase.
Bollinger Bands and Pivot Levels Define Risk
The Bollinger setup adds further context. The daily mid-band sits at $104.44, with the upper band at $122.92 and the lower band at $85.95. HOOD’s recent high of $125.22 pressed right into that upper band before rejecting sharply. That rejection from band extremes signals an overextended move finally running into resistance.
Notably, daily ATR14 reads 7.62, matching the elevated intraday range seen on September 8. Volatility has clearly picked up. At the same time, the daily pivot structure shows the pivot point at $119.88, resistance R1 at $122.68, and support S1 at $114.54. The close at $117.34 landed below the pivot but still above S1, leaving that support zone as the first real test.
Hourly Timeframe: Robinhood Stock Momentum Weakens
The hourly chart tells a more cautious story, with Robinhood stock losing its short-term moving average and posting a bearish MACD crossover.
Mixed Signals Across Moving Averages
Price at $117.32 now sits below the hourly EMA20 of $119.40. However, it remains above the EMA50 at $114.76 and the EMA200 at $106.10. That creates a mixed signal: the medium-term hourly trend is intact, but the shorter hourly average has been lost.
At the same time, RSI14 on the 1H comes in at 46.86, essentially neutral. There is no strong directional push at this resolution. More telling is the MACD: the line at 1.88 has crossed below the signal at 3.03, producing a negative histogram of -1.15. This is a fresh bearish crossover, capturing the loss of short-term upside momentum.
Bollinger Band Break Raises Concerns
Furthermore, the hourly Bollinger Bands reinforce that concern. With the mid-band at $122.18, upper at $125.79, and lower at $118.56, the current price of $117.32 has broken below the lower band. That represents a short-term stress signal, often associated with an oversold snapback condition rather than healthy trend continuation.
Meanwhile, hourly ATR14 sits at 2.00. The hourly pivot at $117.84 with S1 at $116.56 places price right at the edge of that immediate support shelf. Overall, the 1H regime is labeled neutral, and that label fits. The daily trend has not broken, but hourly momentum has clearly deteriorated.
15-Minute Chart: Oversold, But No Confirmed Reversal Yet
The 15-minute chart for Robinhood stock shows deeply oversold conditions that could trigger a technical bounce, though confirmation remains absent.
Zooming in, RSI14 has dropped to 22.60, deep into oversold territory. Price at $117.32 sits below both the EMA20 at $120.10 and EMA50 at $120.59. However, it remains above the EMA200 at $114.90.
Meanwhile, the 15m MACD is negative, with the line at -1.02 versus a signal of -0.73, and the histogram at -0.29. Price has also broken beneath the lower Bollinger Band at $117.89, with the mid-band at $120.33. Therefore, short-term traders should note this oversold zone often produces a technical relief move, without necessarily changing the larger picture. The 15m pivot at $117.56 with S1 at $116.84 marks the immediate reference for any intraday stabilization.
News Backdrop for Robinhood Stock Remains Constructive
Fundamentally, the tape around Robinhood stock has stayed active, with multiple analysts resetting their price targets and ratings on the name.
Goldman and Jefferies both reset their price targets, with reporting pointing to a bigger opportunity emerging. At the same time, Bernstein reiterated its rating on the back of blockchain-related growth prospects.
Strategically, Robinhood also took an equity stake in Crypto.com. It tapped the exchange to power prediction markets through a multi-year deal. This positions Crypto.com as the infrastructure and clearing engine behind what has become Robinhood’s fastest-growing business line. This expansion into prediction markets and crypto infrastructure supports the bullish analyst commentary on Robinhood stock, even as the chart digests a sharp pullback.
Bullish Scenario for Robinhood Stock
The bullish case for Robinhood stock rests on the daily trend holding above critical support levels.
If price stabilizes above S1 support at $114.54 and reclaims the daily pivot near $119.88, the broader EMA alignment and still-positive daily MACD would argue for a resumption toward prior highs. The target zone includes the Bollinger upper band around $122.92 and R1 at $122.68.
Notably, a recovery above the hourly EMA20 at $119.40 would also help resolve the current hourly momentum conflict in favor of buyers. Continued positive analyst commentary alongside the Crypto.com partnership could provide the fundamental tailwind for that move.
Bearish Scenario for Robinhood Stock
On the other hand, the bearish risk centers on the hourly breakdown deepening below S1 support.
A daily close below S1 support at $114.54 would invalidate the near-term bullish setup. This would open the door toward the daily EMA20 near $107.03.
Meanwhile, the negative hourly MACD crossover and the break below the hourly lower Bollinger Band at $118.56 both suggest short-term sellers remain in control. If the 15m oversold condition fails to produce a meaningful bounce off the $116.84–$117.56 zone, further downside pressure toward the daily Bollinger mid-band around $104.44 cannot be ruled out.
Closing Take
Overall, Robinhood stock sits at a genuine inflection point between daily bullish structure and hourly momentum weakness. The daily trend remains bullish on structure, yet the sharp reversal candle and rising ATR signal that volatility has increased meaningfully.
Meanwhile, the hourly and 15-minute timeframes show clear signs of short-term exhaustion. Oversold readings could support a bounce but have not yet confirmed one. Given the elevated ATR readings across timeframes and the conflicting signals between daily strength and hourly weakness, positioning around current levels calls for discipline. The next few sessions, and how price behaves around the $114.54 support and the $119.88 pivot, should clarify whether this is a healthy pause within an uptrend or the start of something more corrective.
FAQ
What is the key support level for Robinhood stock right now?
S1 support at $114.54 is the critical level to watch. A daily close below this level would invalidate the near-term bullish setup and open the door toward the daily EMA20 near $107.03.
Is the daily trend for Robinhood stock still bullish?
Yes. Price remains above the EMA20 at $107.03, EMA50 at $101.49, and EMA200 at $97.18, forming a textbook bullish alignment. The daily regime reading is also classified as bullish, though momentum is cooling from extended levels.
What caused the recent pullback in Robinhood stock?
The pullback followed a sharp rejection from the daily Bollinger upper band near $122.92 after HOOD reached $125.22. The move reflects an overextended rally meeting resistance rather than a fundamental shift in the stock’s outlook.
What are analysts saying about Robinhood stock?
Analyst commentary remains broadly constructive. Goldman and Jefferies have reset their price targets, while Bernstein reiterated its rating citing blockchain-related growth prospects. The Crypto.com partnership and expansion into prediction markets have been cited as structural tailwinds.
Disclaimer: This article is for informational purposes only and does not constitute financial advice, an investment recommendation, or a solicitation to buy or sell any financial instrument or cryptocurrency. The analysis provided is not indicative of future results. Investing in crypto assets and financial markets carries a high risk of capital loss. Always do your own research (DYOR) and consult a qualified financial advisor before making any decision.
Article produced with the assistance of artificial intelligence and reviewed by the editorial team.