
As of September 16, 2026, $XRP finds itself trapped between support and resistance, with the Ripple price today reflecting a market paralyzed by indecision. The broader crypto space shed 4.70% in 24 hours according to CoinGecko, dragging total capitalization to roughly $2.59 trillion.
Key takeaways
- $XRP is trading at $1.30 on the daily chart, pinned between support at $1.28 and resistance at $1.31.
- The daily timeframe is neutral, while the hourly chart shows a bearish EMA alignment with RSI14 at 34.91.
- Total crypto market capitalization dropped 4.70% to $2.59 trillion, with Bitcoin dominance elevated at 58.49%.
- The Fear & Greed Index sits at 51 (Neutral), confirming a lack of conviction across the market.
- A break above $1.31 or below $1.28 will likely determine the next directional move for $XRP.
Daily Chart: $XRP Sits in a Neutral Squeeze With No Clear Directional Bias
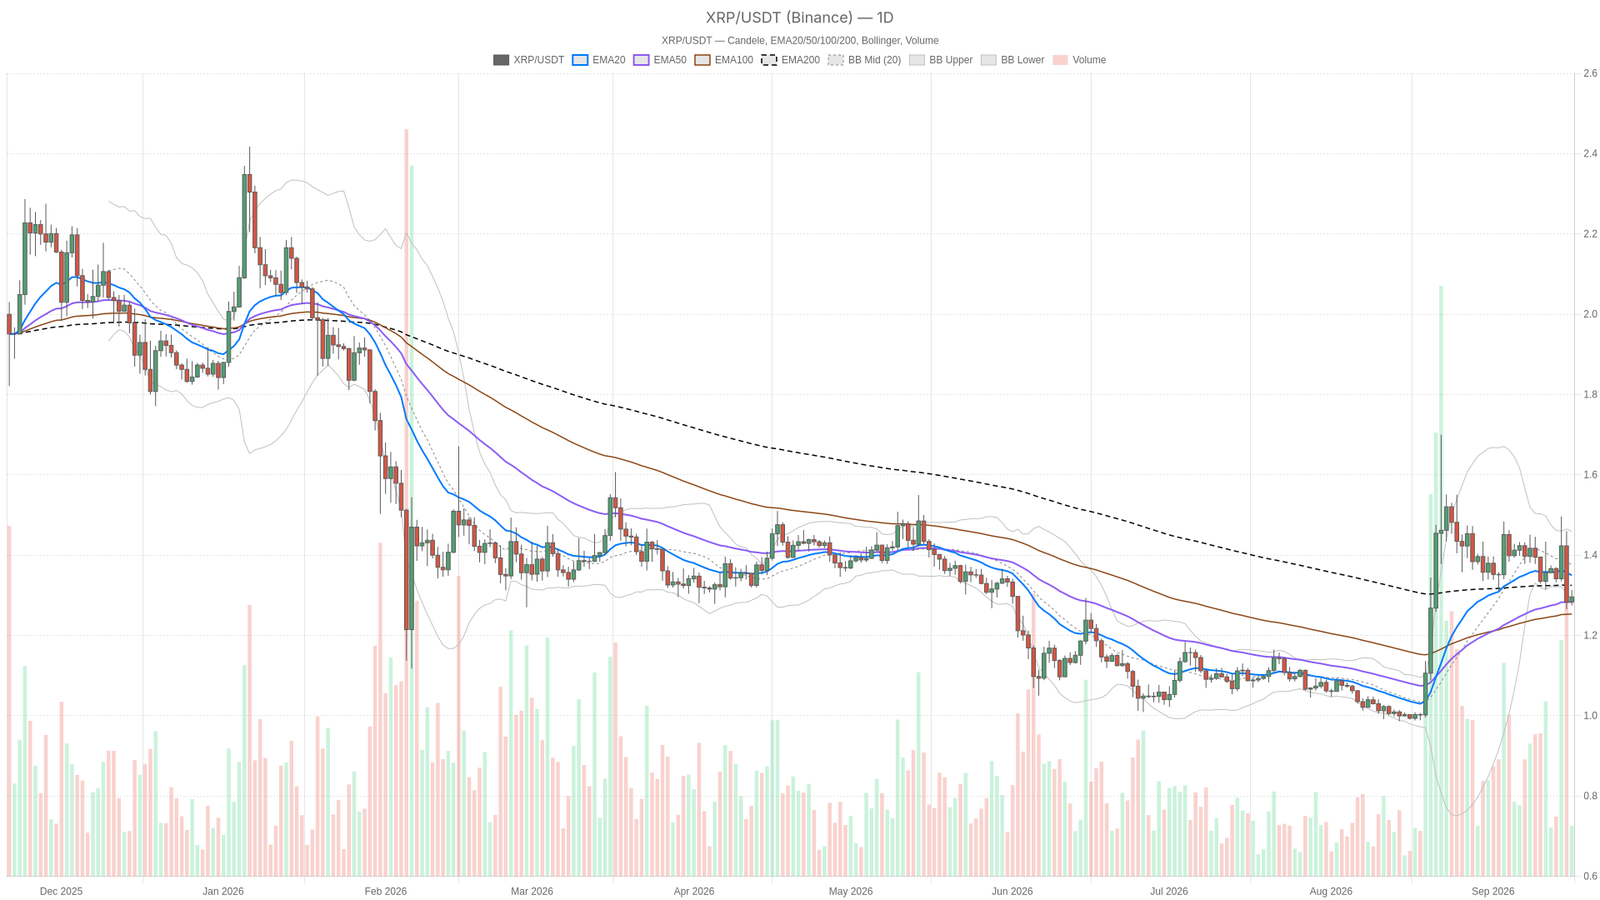
On the daily timeframe, the Ripple price today sits at $1.30, boxed in by moving averages rather than riding them. Price is below the EMA20 at $1.35 and below the EMA200 at $1.32, but still above the EMA50 at $1.28. That is not a trend — it is a squeeze, with three averages pointing in different positions relative to spot. When EMAs stack this way, the market is typically consolidating after a recent move, and the next tick should not be assumed to confirm a direction.
RSI14 on the daily sits at 46.36, just under the midline. It is not oversold, nor overbought — a momentum reading that mirrors the EMA picture of mild hesitation. However, the MACD line at 0.02 remains above zero but sits below its signal line of 0.04, and the histogram has turned negative at -0.02. That is a subtle warning: momentum that was positive is now fading, even if it has not flipped fully bearish yet.
The Bollinger Bands add further context. The mid-band stands at $1.38, the upper band at $1.46, and the lower band at $1.29. With $XRP trading right on top of that lower band, the pair is compressed toward the bottom of its volatility envelope. This can mean either that sellers are firmly in control and price is about to slide through support, or that the move is overextended to the downside and due for a mean-reversion bounce toward $1.38. ATR14 on the daily is $0.08, framing realistic day-to-day swings.
Moreover, pivot levels reinforce the tight coiling: daily pivot at $1.29, resistance R1 at $1.31, support S1 at $1.28. Price hovers just above the pivot, in the no-man’s-land between the two. Nothing decisive happens until one of those levels breaks with conviction.
Hourly Structure: Where the Bearish Pressure Actually Shows Up
The tension between timeframes becomes real on the 1H chart. $XRP’s close of $1.29 sits below its EMA20 ($1.32), below its EMA50 ($1.35), and below its EMA200 ($1.38) — a clean, stacked bearish alignment. Unlike the daily, there is no ambiguity here: the shorter-term trend structure points downward, and every average above price acts as a lid.
RSI14 on the hourly has dropped to 34.91, closing in on oversold territory without quite reaching it. Sellers have been pressing, but momentum has not been exhausted yet — there could be more room to fall before this gets stretched. MACD on the 1H is essentially flat and negative, with the line and signal both at -0.03 and a histogram reading of zero. That flatness matters: it is not a fresh bearish signal, but stalling momentum, which often precedes either a bounce attempt or a continuation once new selling volume appears.
Meanwhile, the hourly Bollinger Bands — mid at $1.33, upper at $1.43, lower at $1.22 — show price sitting below the mid-band, consistent with the broader downward lean. The tight hourly pivot cluster signals a market compressing right at a decision point rather than trending cleanly in either direction.
15-Minute View: Pure Compression, No Signal Yet
Zooming into the 15-minute chart, everything flattens out. RSI14 reads 46.45 — almost dead center, neutral. MACD line, signal, and histogram are all sitting at zero, which is about as close to “no signal” as this indicator gets. The Bollinger Bands have collapsed into a narrow range, and ATR14 has shrunk to just $0.01. This is a classic pre-move compression pattern: volatility has been squeezed out of the short-term chart, and whichever way it resolves will likely set the tone for the next few hours of trading.
Bullish Scenario for $XRP
For bulls to regain any real footing, $XRP must reclaim the hourly EMA20 near $1.32 and push back above the daily EMA20 at $1.35. Ideally, RSI on both timeframes would climb back above 50, and the daily MACD histogram would flip positive again. A clean break above daily R1 at $1.31 would be the first indication that buyers are stepping back in, opening a path toward the Bollinger mid-band at $1.38 and eventually the upper band near $1.46. That said, this scenario gets invalidated quickly if price cannot hold above $1.31 on a closing basis, or if it slips back under the daily support at $1.28.
Bearish Scenario for $XRP
Conversely, the bearish case is arguably better supported given the hourly EMA stack and the sub-35 RSI on that timeframe. If $XRP fails to hold the daily pivot zone around $1.29–$1.30 and breaks the daily support at $1.28, the next reference points open up toward the lower Bollinger extremes on both the daily and hourly charts. A move like that would confirm sellers are extending control beyond the intraday chart and into the broader daily structure. This scenario would be invalidated if price reclaims the daily pivot and stabilizes above the EMA50 at $1.28, which would suggest the recent weakness was merely noise rather than a structural shift.
What This Means for Anyone Watching $XRP
Right now, the honest read is that this is a market without a dominant force. The daily chart is neutral by its own definition, the hourly chart is bearish but with momentum that is stalling rather than accelerating, and the 15-minute chart is too compressed to offer any directional conviction. Add a broader crypto market that just shed nearly 4.70% of its total capitalization in a day and a Fear & Greed reading sitting dead in neutral at 51, and you get a picture of a market that is paused, not committed.
That combination — daily indecision, hourly weakness, and a compressed short-term chart — is exactly the kind of setup where volatility can expand quickly in either direction once one of the key levels breaks. How $XRP behaves around the $1.28–$1.31 range over the next sessions will likely reveal more than any single indicator reading. Given elevated Bitcoin dominance at 58.49% and the risk-off tone across the broader market, caution around chasing either direction until the structure actually resolves seems the more disciplined approach.
FAQ
What are the key support and resistance levels for $XRP right now?
Immediate support sits at $1.28 (daily S1), while resistance stands at $1.31 (daily R1). Below $1.28, the next reference point opens toward the hourly Bollinger lower band at $1.22. Above $1.31, the path leads toward the Bollinger mid-band at $1.38 and eventually the upper band near $1.46.
Is the current $XRP market structure more bullish or bearish?
The daily chart is technically neutral, but the hourly chart shows a clean bearish alignment with price below all three EMAs and RSI14 at 34.91. The bearish case is arguably better supported in the short term, though momentum is stalling rather than accelerating, which keeps the picture mixed.
What needs to happen for $XRP to turn bullish again?
$XRP would need to reclaim the hourly EMA20 near $1.32 and push above the daily EMA20 at $1.35, with RSI climbing back above 50 on both timeframes. A clean break above daily R1 at $1.31 would be the first tell that buyers are stepping back in.
Disclaimer: This article is for informational purposes only and does not constitute financial advice, an investment recommendation, or a solicitation to buy or sell any financial instrument or cryptocurrency. The analysis provided is not indicative of future results. Investing in crypto assets and financial markets carries a high risk of capital loss. Always do your own research (DYOR) and consult a qualified financial advisor before making any decision.
Article produced with the assistance of artificial intelligence and reviewed by the editorial team.