
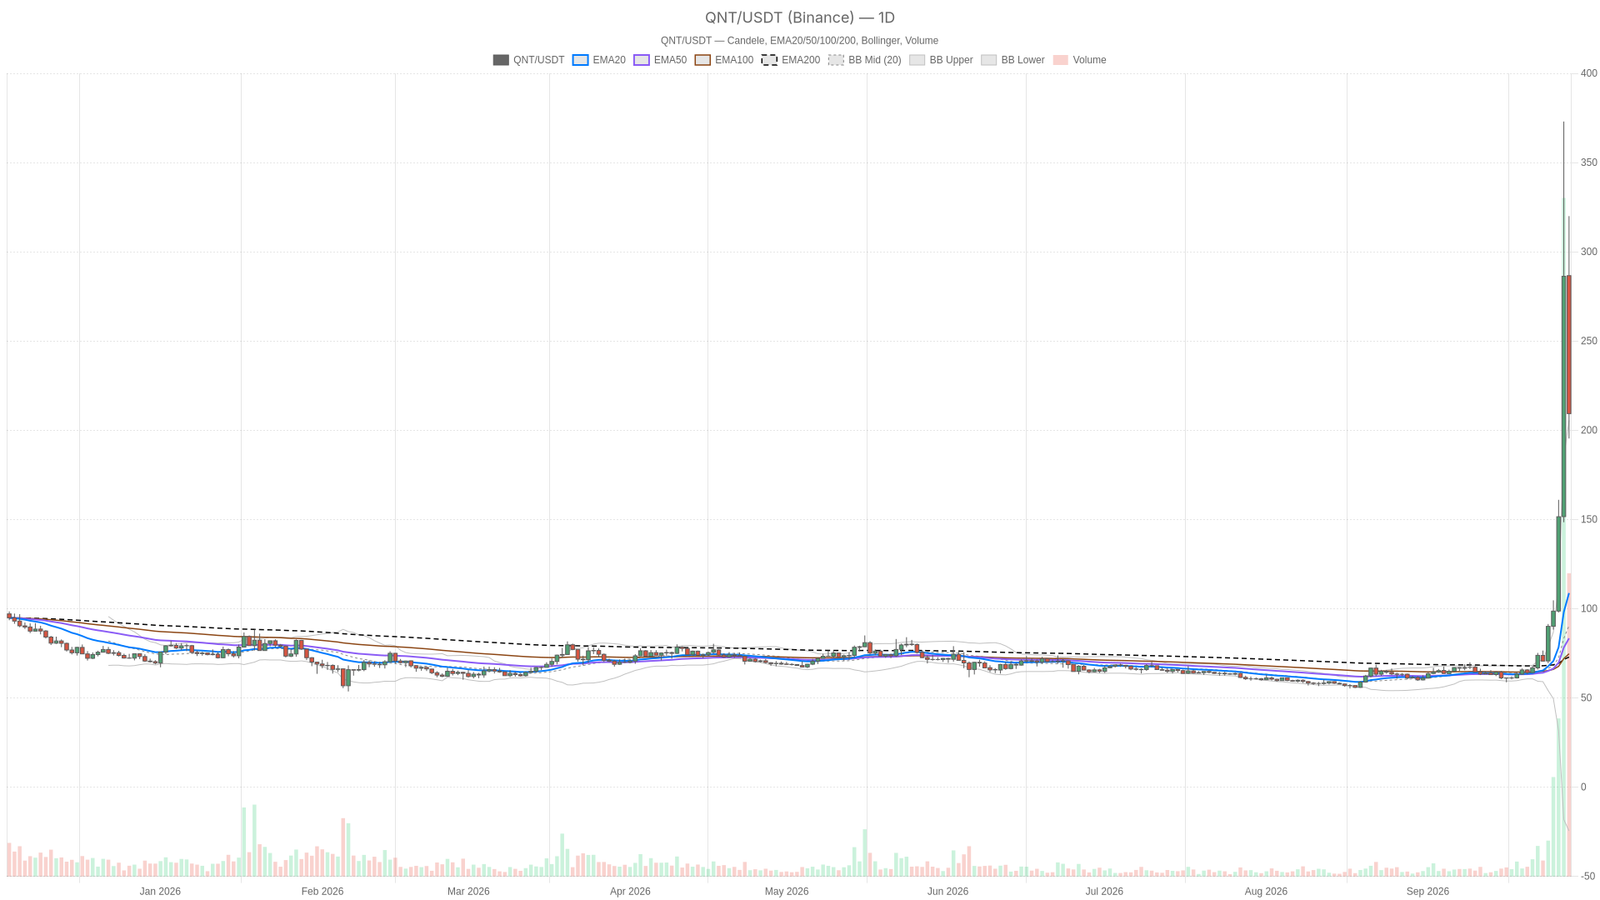
A robust daily uptrend meets short-term exhaustion in the $QNT market. As of September 28, 2026, Quant crypto today captures a clear tension: price at $209.28 sits above every major moving average, but hourly indicators flash caution after the broader market shed roughly 5% in a single session.
Key takeaways
- $QNT trades at $209.28, above the EMA20, EMA50, and EMA200 on the daily chart, confirming an intact structural uptrend.
- Daily RSI at 70.76 signals overbought conditions, while the 15-minute RSI at 25.43 has dropped into oversold territory.
- Total crypto market capitalization fell roughly 5% in 24 hours, with Bitcoin dominance climbing to 58.68%.
- Fear & Greed Index sits at 74 (Greed), historically elevated for altcoin risk exposure.
- Daily ATR of 34.93 and hourly ATR of 43.9 confirm elevated volatility across all relevant timeframes.
Content, live market tracking, portfolio management, and price alerts — everything you need in the Crypto News app.
Download now, stay on top of the crypto market, and take control of your information.
The Daily Trend: Still Bullish, But Getting Stretched
On the D1 chart, the structure is unambiguous. Price at $209.28 sits well above the EMA20 at $108.75, the EMA50 at $83.39 and the EMA200 at $72.88. That stacking — short-term average above medium-term above long-term — is the textbook signature of a trend that has not broken down. The daily regime reading confirms it: bullish.
The RSI at 70.76 backs that story, but it also carries a warning. Readings above 70 usually mean buyers have controlled price without much resistance. That is great for trend-followers, yet it leaves little room before profit-taking takes over. MACD tells a similar story from a different angle: the line at 31.63 sits well above the signal at 12.99, with a histogram of 18.64, showing strongly positive momentum. However, extended momentum of this kind tends to precede a cooling-off rather than an immediate acceleration.
Moreover, the Bollinger Bands add weight to that read. Price at $209.28 is trading essentially on top of the upper band at $205.56, meaning volatility has expanded hard to the upside and the asset is technically stretched relative to its own recent range. The daily ATR of 34.93 confirms just how wide these swings have become — a huge average daily range for an asset in the low $200s that signals volatility, not calm accumulation, is driving this tape.
Furthermore, pivot levels reinforce the idea that price has pulled back from its highs. The daily pivot sits at $241.54, well above the current close, with resistance R1 at $287.74 and support S1 at $163.09. $QNT is trading below its own daily pivot — a sign that even though the broader trend is bullish, the most recent price action has lost some edge.
What the Hourly Chart Reveals About $QNT
This is where the tension really shows up. On the H1 timeframe, price at $209.21 is trading below the EMA20 at $235.83 but still above the EMA50 at $193.52 and well above the EMA200 at $120.70. That is a mixed setup. The intermediate structure remains constructive, yet the most recent hourly average has flipped into resistance rather than support. This usually points to a corrective phase inside a bigger uptrend rather than a reversal.
RSI at 46.78 is essentially neutral, sitting right in no-man’s-land — no oversold bounce signal, no overbought warning either, just consolidation. MACD is more revealing: the line at 21.31 has crossed below the signal at 27.74, producing a negative histogram of -6.44. That is short-term momentum fading, consistent with a pause after the strong daily rally rather than a fresh breakdown.
Meanwhile, the hourly pivot at $215.01, with support at $189.55 and resistance at $234.67, frames the current battle. Price sitting between the pivot and S1 suggests sellers have had the upper hand over the last several hours. The broader trend has not been damaged, however — this remains a correction within an uptrend for now.
The 15-Minute Picture: Execution Context
Drilling into the 15-minute chart is useful mainly for timing, not for changing the overall bias. Price at $208.77 trades well below both the EMA20 at $247.85 and EMA50 at $247.34. RSI has dropped to 25.43 — genuinely oversold territory on this timeframe. MACD is negative across the board, with the line at -11.16 and histogram at -7.62, confirming active short-term selling pressure.
The tight 15-minute pivot cluster — pivot at $208.83, resistance at $211.08, support at $206.53 — shows price is essentially glued to its own pivot point. This is typical of a market waiting for a catalyst rather than committing to a direction. For execution purposes, this oversold short-term reading matters: any bounce attempt is more likely to originate here than from a fresh breakout.
Bullish Scenario
The bullish case for Quant crypto today rests on the daily structure holding. As long as price stays above the EMA20 near $108.75 and does not lose the broader trend support built up since the EMA50 and EMA200 climb, the primary uptrend remains intact. A reclaim of the daily pivot at $241.54, followed by a push toward R1 at $287.74, would confirm buyers are back in charge and this pullback was simply a pause.
What would invalidate this? A daily close that breaks decisively below the EMA20 at $108.75 or slices through S1 at $163.09 would undercut the bullish structure. That would suggest the recent rally is unwinding faster than a normal correction and demand a reassessment of the trend.
Bearish Scenario
Conversely, the near-term bearish case is built on what the hourly and 15-minute charts already show: fading momentum and price trading below the H1 EMA20. The broader backdrop compounds this: total crypto market cap fell roughly 5% in 24 hours while Bitcoin dominance pushed to 58.68%. That combination — capital rotating toward $BTC alongside a Fear & Greed score of 74 — is exactly the setup where altcoins like $QNT can underperform even when their own daily trend remains intact.
A break below H1 support at $189.55 would open the door toward a deeper retracement, with the daily EMA20 near $108.75 becoming the next real structural test. What would invalidate this? A reclaim of the H1 pivot at $215.01, combined with the MACD histogram flipping positive on the hourly chart, would suggest the correction is losing steam and that buyers are stepping back in before real damage is done.
Positioning, Risk and What to Watch
Right now, $QNT presents a study in contrast: a daily trend that is still objectively bullish, sitting on top of a short-term momentum picture that is clearly cooling off. All this unfolds while the wider market just absorbed a sharp risk-off move. The daily ATR of 34.93 and hourly ATR of 43.9 both point to elevated volatility, meaning whichever direction this resolves, the moves are likely to be sharp rather than gradual.
However, the tension between an overbought daily RSI and an oversold 15-minute RSI deserves attention rather than quick resolution. It is a genuine disagreement between timeframes, not noise. Traders leaning on the bullish daily structure need to respect that the hourly chart has already priced in hesitation. Moreover, a Fear & Greed reading of 74 alongside a falling total market cap is not a comfortable combination for altcoins.
Ultimately, there is no need to force a directional call here. The more useful approach is watching whether the hourly and daily timeframes start agreeing again — either through a reclaim of key pivot and EMA levels above, or through a clean break of support confirming the correction has further to run. Either way, volatility is elevated, conviction should be sized accordingly, and the next few sessions should clarify which story actually wins out.
FAQ
Is Quant still in a bullish trend?
Yes, the daily chart structure remains objectively bullish. Price at $209.28 sits well above the EMA20 ($108.75), EMA50 ($83.39), and EMA200 ($72.88), with the stacking order confirming an intact uptrend. The daily regime reading also confirms a bullish designation. However, the short-term momentum on lower timeframes has cooled, suggesting a corrective phase within the broader uptrend rather than a reversal.
What are the key support levels to watch for $QNT?
The most immediate support on the hourly chart sits at $189.55 (S1). Below that, the daily EMA20 near $108.75 represents the next structural floor. A daily close below $163.09 (daily S1) would signal a more serious breakdown. On the resistance side, reclaiming the hourly pivot at $215.01 and eventually the daily pivot at $241.54 would confirm a bullish resurgence.
What does the RSI divergence between timeframes mean?
The daily RSI at 70.76 signals overbought conditions on the macro timeframe, while the 15-minute RSI at 25.43 is oversold. This divergence reflects a genuine tension: the larger trend remains strong, but short-term buying pressure has exhausted itself. Such disagreements between timeframes often precede a period of consolidation rather than an immediate directional move in either direction.
Why is $QNT underperforming despite a bullish daily trend?
The broader market context explains much of the short-term weakness. Total crypto market capitalization fell roughly 5% in 24 hours, and Bitcoin dominance climbed to 58.68%, signaling capital rotation toward $BTC. Combined with a Fear & Greed Index reading of 74 (Greed), this creates an environment where altcoins often underperform regardless of their individual technical strength.
Disclaimer: This article is for informational purposes only and does not constitute financial advice, an investment recommendation, or a solicitation to buy or sell any financial instrument or cryptocurrency. The analysis provided is not indicative of future results. Investing in crypto assets and financial markets carries a high risk of capital loss. Always do your own research (DYOR) and consult a qualified financial advisor before making any decision.
Article produced with the assistance of artificial intelligence and reviewed by the editorial team.