After running straight into a cluster of local resistance levels that have consistently capped every attempt at recovery throughout July, $XRP has reached a critical technical point. Although the asset has stabilized after its sharp decline in June, the most recent rejection indicates that bulls still have a tough battle ahead of them before momentum can turn in their favor.
$XRP's next direction isn't yet clear
After failing to break through the convergence of the 50-day and 100-day moving averages close to the $1.09-$1.10 range, $XRP is currently trading around $1.08. The current configuration is especially crucial for determining $XRP's next direction, since those two indicators have emerged as the first significant resistance zone since the start of the larger correction.
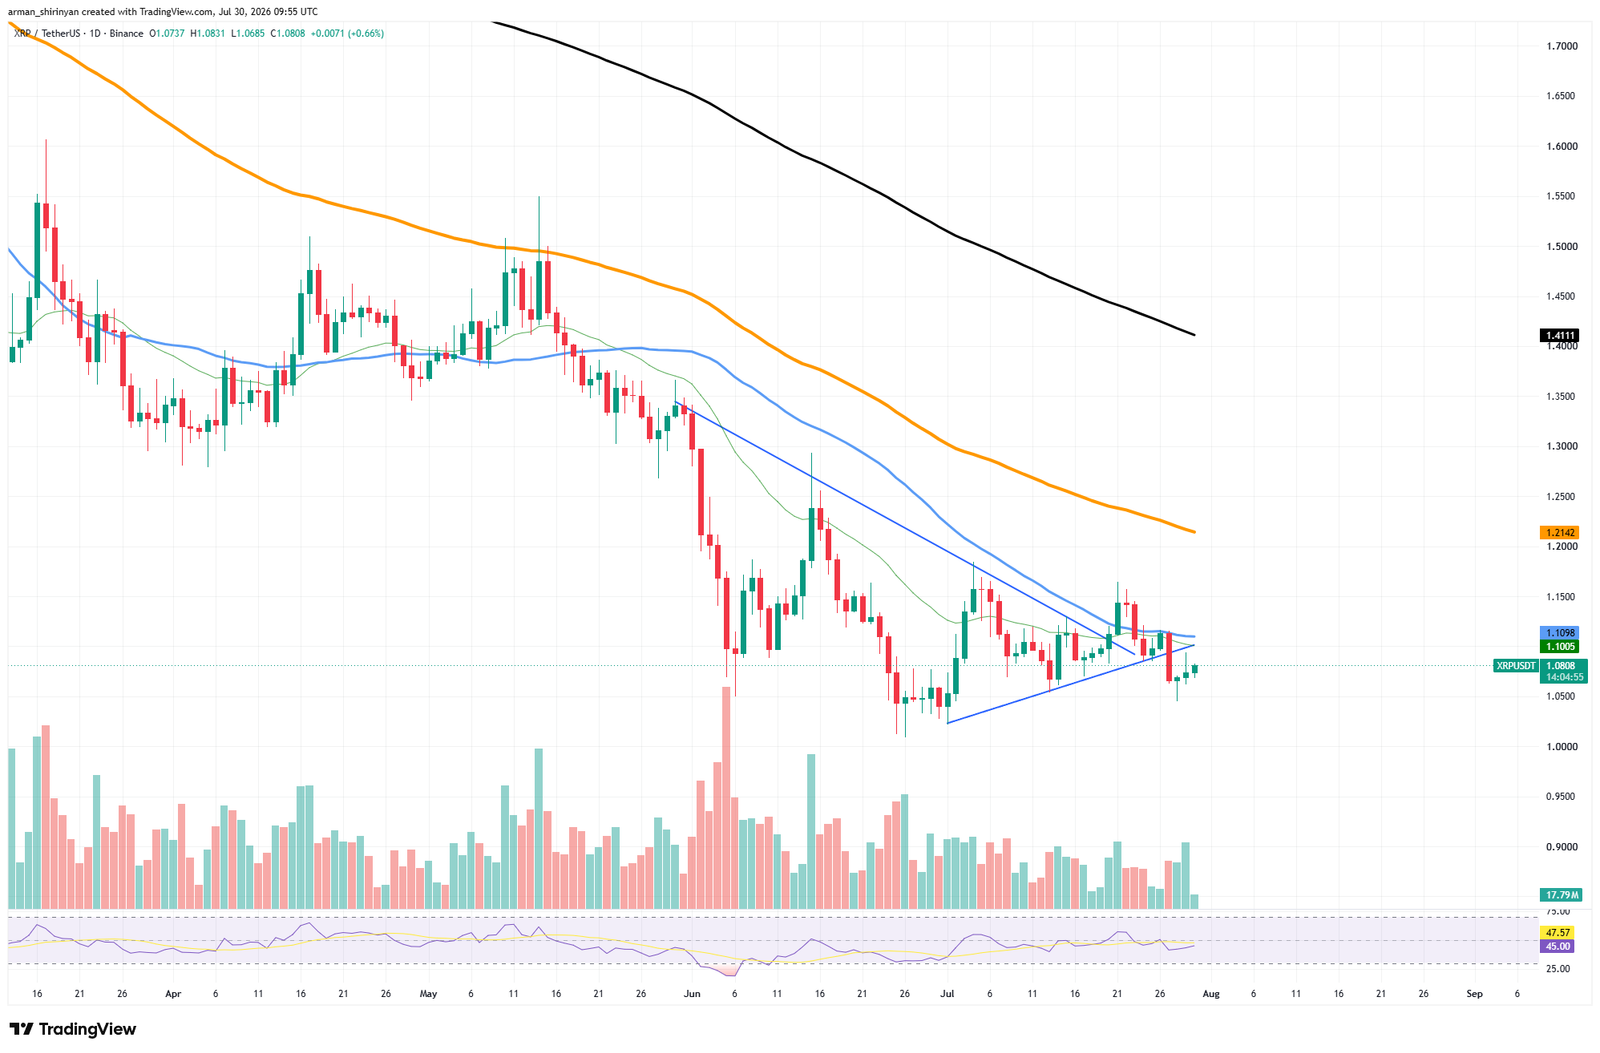
A breakout attempt from an ascending triangle that ultimately failed to generate sufficient buying pressure is highlighted in the daily chart. $XRP is currently consolidating just below the moving averages after falling back below the previous breakout area, rather than continuing upward.
Even though the breakdown was rather small, it supports the notion that sellers are consistently active when the price gets close to dynamic resistance. The overall trend has not yet improved. The 200-day moving average, which continues to trend significantly higher around $1.21, shows how much work buyers still have to do before the longer-term technical outlook turns positive.
$XRP's conviction remains unclear
Rallies are unlikely to indicate the start of a long-term uptrend until $XRP starts regaining these key moving averages one by one. Additionally, volume has been comparatively quiet during the most recent attempts at recovery. Although increasing participation is usually necessary for strong breakouts, current trading activity indicates that market conviction is still lacking.
The resistance around $1.10 may continue to reject advances in the absence of a discernible increase in buying volume. Indicators of momentum show the market's hesitancy. The bearish momentum has lessened but has not vanished, according to the Relative Strength Index, which is currently at about 46, just below the neutral 50 level.
The lack of overbought conditions indicates that buyers have not yet taken control, but it also provides an opportunity for another upside attempt. In addition to regaining the 50-day and 100-day moving averages, $XRP needs a strong daily close above the $1.10 resistance zone in order for the bullish scenario to intensify.
A move like this might draw attention to the next significant obstacle, which is located around the 200-day moving average at $1.21. The likelihood of another test of the psychologically significant $1.00 level would rise if the $1.05–$1.06 support area were not maintained. $XRP has entered one of its most crucial technical moments in recent weeks, with the price directly below significant resistance and above crucial support.