
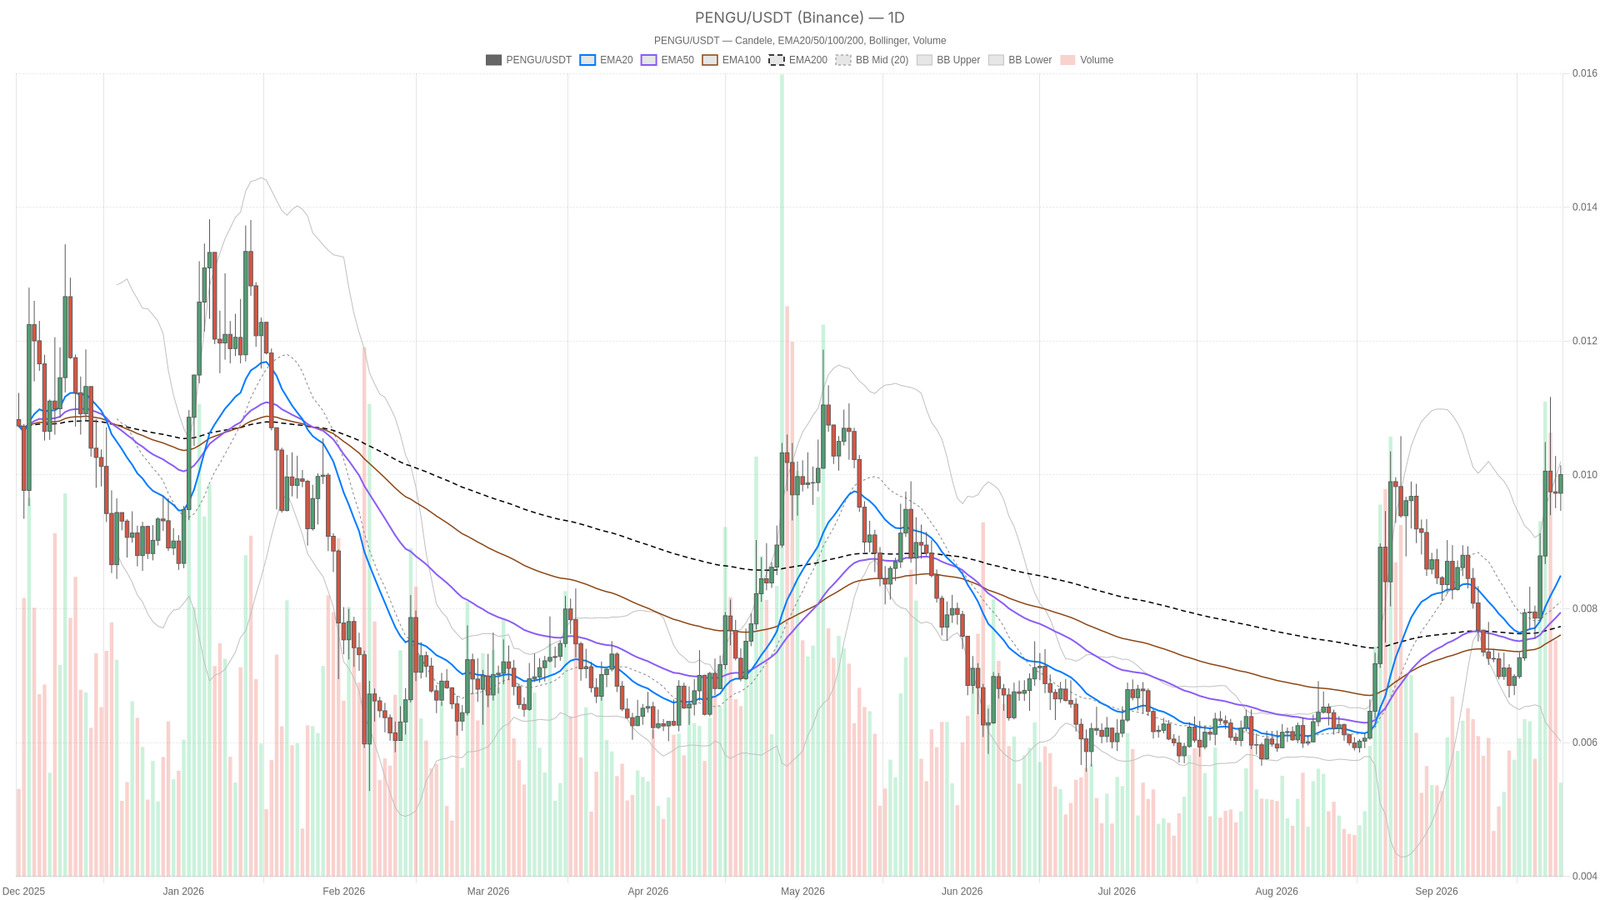
As of late September 2026, Pengu crypto is caught in one of the tightest technical coils its chart has produced recently. Moving averages across multiple timeframes have converged, volatility has dried up, and the daily chart remains bullish even as lower-timeframe momentum begins to fade.
Key takeaways
- Daily EMAs (20, 50, 200) have converged around current price, signaling a coiled market primed for expansion.
- The daily RSI sits at 68.8, bullish but uncomfortably close to overbought territory.
- The 1-hour chart remains bullish with RSI at 59.55, while the 15-minute timeframe has flipped neutral despite an RSI of 62.3.
- Near-zero ATR14 suggests the next move will likely be sharper than usual once the range breaks.
- The Fear & Greed Index at 71 and Bitcoin dominance near 58.8% define the macro backdrop for any breakout.
Daily Bias: Pengu Crypto Still Leans Bullish, But Momentum Is Getting Stretched
The daily chart for Pengu crypto leans bullish, supported by an RSI of 68.8, but momentum indicators are signaling exhaustion rather than fresh strength. The reading sits firmly in the upper range that typically accompanies a trend with real participation behind it.
However, 68.8 is close enough to overbought territory that it deserves respect rather than blind faith. Trends can keep grinding higher with RSI in this zone, but the room for further acceleration without a pause or shallow pullback starts to shrink.
What stands out more is the EMA structure. The 20, 50 and 200-period exponential averages on the daily chart have essentially converged on the same level. That is not typical of a mature, well-separated trend — it is the signature of a market deciding whether to push away from its averages or fold back into the range.
Moreover, the MACD line, signal and histogram are all sitting flat at zero, yielding a momentum picture that is neutral in practice even while the trend label says bullish. The Bollinger Bands tell the same story: upper, middle and lower bands have compressed tightly around price, and the ATR14 reading has effectively dropped to zero. This is a coiling market — the kind of setup that resolves with an expansion move once the pressure releases.
1H and 15-Minute Timeframes Show the Trend Losing Some of Its Edge
The shorter timeframes reveal a mixed picture for the token: the 1-hour chart remains bullish, but the 15-minute chart has shifted to neutral despite a healthy RSI reading. The 1-hour chart still carries a bullish regime tag, with RSI at 59.55 — healthy, unremarkable, nowhere near stretched. That is a constructive sign: shorter-term momentum has not overheated even as the daily RSI sits closer to 69.
The 15-minute timeframe, however, is where the crack in the narrative shows up. Despite an RSI of 62.3, which on its own would read as mildly bullish, the regime classification there is neutral, not bullish. That is a genuine disagreement worth flagging: the momentum oscillator leans one way while the broader structural read on the same timeframe leans the other.
Put together, the multi-timeframe picture is: daily bullish but momentum-stretched, 1H bullish but unremarkable, 15m neutral despite decent RSI. That is not a clean trend continuation signal, nor is it a clean reversal signal. It is a market waiting for the next catalyst to force a decision, with the daily structure still holding the benefit of the doubt for now.
Bullish and Bearish Scenarios
Two distinct scenarios define the next likely move: a breakout above the compressed EMA cluster that confirms the daily bullish regime, or a breakdown that triggers a corrective pullback. Both remain in play until the coil resolves.
The bullish case
If price breaks decisively out of this EMA and Bollinger compression to the upside, with the MACD histogram turning positive and the ATR14 finally expanding off its flatline, the daily bullish regime would get real confirmation rather than just a label. A move like that, combined with RSI holding above 60 across timeframes without immediately rolling over, would suggest the pause was accumulation rather than exhaustion.
This scenario gets a tailwind from broader sentiment: the Fear & Greed Index currently sits at 71, in Greed territory, which tends to coincide with more risk appetite flowing into smaller-cap tokens once Bitcoin’s own trend allows it. The bullish case would be invalidated if price fails to break the EMA cluster with conviction and RSI on the daily starts fading from these elevated levels — that would point to the bullish tag being stale rather than active.
The bearish case
The bearish scenario centers on the daily RSI’s proximity to overbought and the fact that momentum indicators are not fully endorsing the bullish tag. If price loses the tight pivot and EMA cluster to the downside, that would tip the balance toward a corrective pullback rather than a breakout.
This is especially relevant given that total crypto market capitalization sits near $2.88 trillion but is down about 1.35% over 24 hours, according to CoinGecko data, and Bitcoin dominance remains elevated at roughly 58.8% — a backdrop that tends to starve smaller altcoins of independent liquidity. The bearish case would be invalidated if buyers reclaim the pivot zone with the EMAs holding as support and RSI stabilizes back above the 60s across the 1H and daily charts.
Positioning and Risk
Right now, the asset is not offering a high-conviction directional signal. It is offering a compressed setup with a daily bias that still deserves some respect but is not being aggressively confirmed by the shorter timeframes. The near-zero ATR reading is the detail that matters most here: when volatility drops this low, the eventual move tends to be sharper than usual once it starts, in either direction.
Anyone tracking this chart should treat the current calm as temporary rather than a new normal. Size for the possibility of a fast expansion once the range breaks, and pay attention to whether the 15-minute neutral tag starts aligning with the 1H and daily bullish reads or diverging further. Given the elevated Greed reading in the broader market and Bitcoin’s continued dominance over available liquidity, the resolution of this coil is likely to hinge as much on broader market risk appetite as on its own chart.
FAQ
Is the token still in a bullish trend?
Yes, the daily chart maintains a bullish regime tag with an RSI of 68.8. However, the EMA convergence and flat MACD suggest the trend is pausing rather than aggressively advancing, and the 15-minute timeframe has turned neutral.
What does the EMA convergence mean for the price?
When the 20, 50 and 200-period EMAs converge on the same level, it signals a coiled market that has caught up with its own averages. This type of compression rarely lasts and typically resolves with a sharp expansion move in either direction once the pressure releases.
What are the key levels to watch?
The tight pivot, resistance and support cluster around current price, defined by the converged EMAs and Bollinger Bands, is the critical zone. A decisive break above it with expanding ATR14 would confirm the bullish case, while a loss to the downside would favor a corrective pullback.
How does the broader market affect the outlook?
The Fear & Greed Index at 71 suggests elevated risk appetite, which historically benefits smaller-cap tokens. However, Bitcoin dominance near 58.8% and a slight decline in total crypto market cap to $2.88 trillion indicate that altcoin liquidity remains constrained, making independent rallies more difficult.
Disclaimer: This article is for informational purposes only and does not constitute financial advice, an investment recommendation, or a solicitation to buy or sell any financial instrument or cryptocurrency. The analysis provided is not indicative of future results. Investing in crypto assets and financial markets carries a high risk of capital loss. Always do your own research (DYOR) and consult a qualified financial advisor before making any decision.
Article produced with the assistance of artificial intelligence and reviewed by the editorial team.