
Palantir Technologies Inc. stock sits at a genuine crossroads. The daily chart still carries a bearish signature, yet a strong Q2 earnings report has injected fresh momentum into the shorter-term picture. That combination — weak trend structure against a powerful fundamental catalyst — demands careful dissection.
Key takeaways
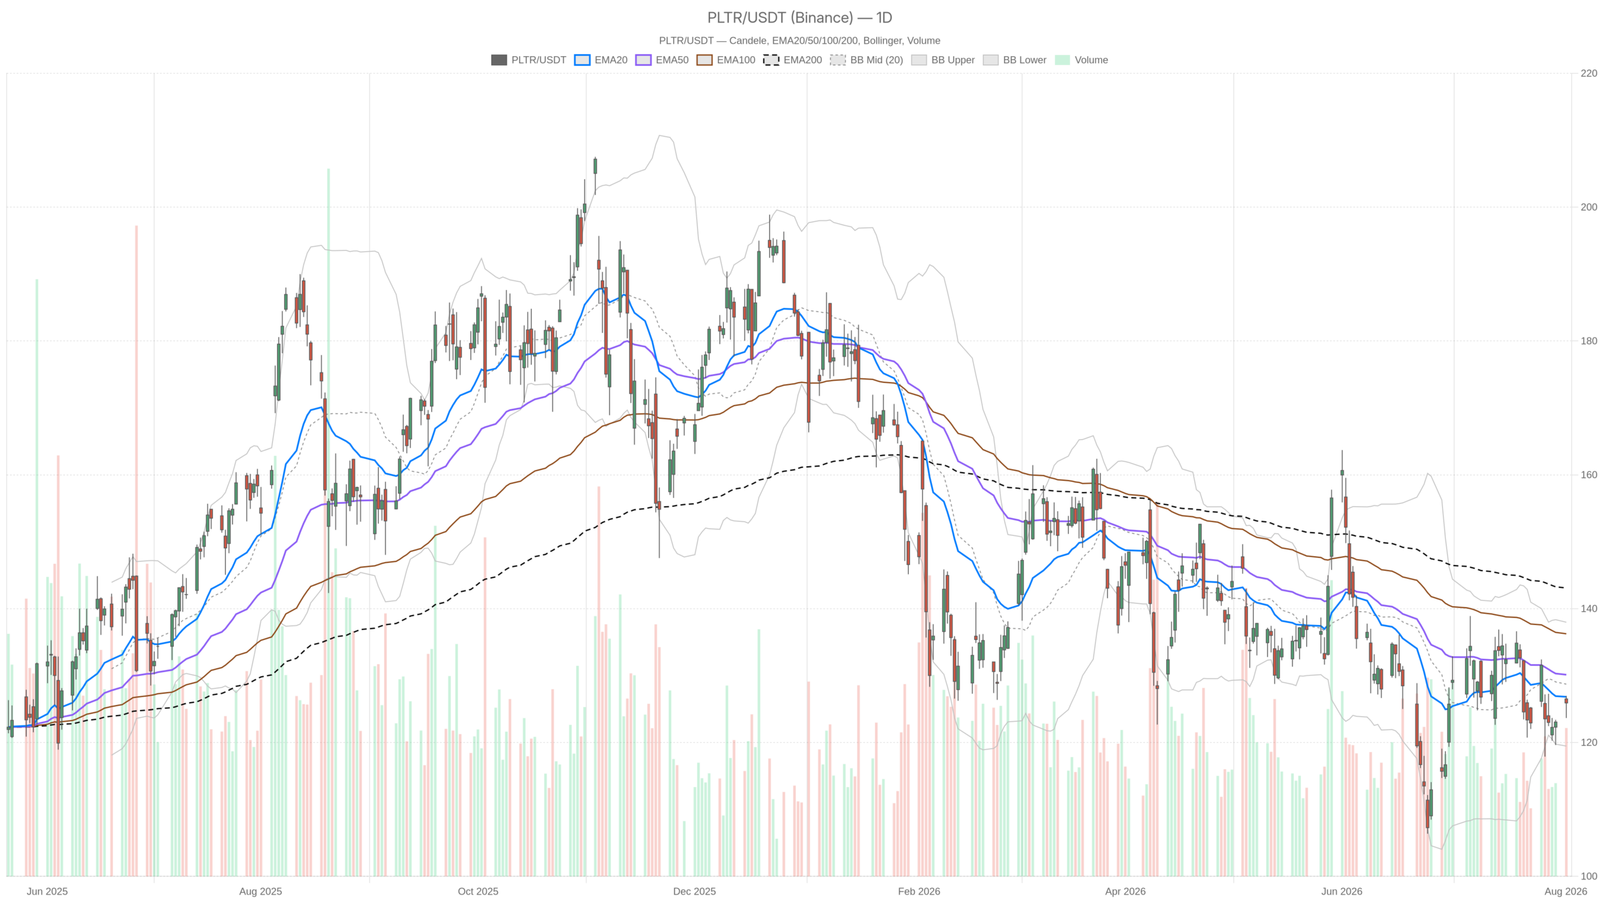
- PLTR closed at 125.91, below its EMA20 (126.83), EMA50 (130.13), and EMA200 (143.09) — a bearish daily moving average stack.
- Daily MACD sits at -1.51 below its signal line at -1.05, with a negative histogram of -0.46, confirming downside momentum control.
- Hourly RSI14 has climbed to 59.35, and hourly MACD has turned positive, signaling a short-term bullish shift after earnings.
- The earnings beat and raised full-year guidance triggered the divergence between bearish daily and bullish hourly signals in Palantir stock.
- Daily ATR14 at 5.92 signals elevated volatility, with PLTR near a decision point across multiple timeframes.
Daily Chart Structure Remains Bearish for Palantir Technologies Inc. Stock
Palantir Technologies Inc. stock remains in a textbook bearish trend on the daily chart. Price sits below all three major moving averages, and momentum indicators confirm downside control. This structure matters because it represents the dominant trend that any short-term bounce must overcome.
On the daily timeframe, PLTR closed at 125.91. Price sits below its EMA20 at 126.83, EMA50 at 130.13, and dramatically below its EMA200 at 143.09. That kind of stacking — price under all three major moving averages — is a textbook bearish trend alignment. The daily regime reading confirms it outright: bearish.
Momentum tells the same story. The daily MACD line sits at -1.51, below its signal line at -1.05, with a negative histogram of -0.46. In other words, downside momentum has been in control, even if it is not accelerating aggressively. Meanwhile, RSI14 on the daily is at 48, a neutral reading that shows sellers have not pushed the market into oversold extremes. However, buyers have not reclaimed control either.
The daily Bollinger Bands frame the broader volatility context: mid-band at 128.72, upper at 137.97, lower at 119.47. Price trades below the midline and closer to the lower band. This reinforces the idea that the broader structure still leans defensive. The ATR14 reading of 5.92 confirms this is not a quiet stock — daily ranges remain wide, and volatility cuts both ways.
Short-Term Charts Flip Bullish After Palantir’s Earnings
The hourly chart tells a different story. Palantir Technologies Inc. stock has flipped to a constructive short-term posture following the earnings beat. The regime shifts to neutral, and the tone turns noticeably more upbeat.
Hourly Momentum Turns Constructive
Price at 125.91 now trades above both the EMA20 at 124.27 and the EMA50 at 124.77. It remains below the EMA200 at 128.07, however. RSI14 has climbed to 59.35, a level that suggests intraday buyers have taken the upper hand. The hourly MACD backs this up. The line at 0.54 sits above its signal at 0.02, producing a positive histogram of 0.52. That is a clear bullish momentum shift on the shorter timeframe, directly contradicting the daily bearish tone.
On the hourly Bollinger setup, price near 125.91 trades close to the upper band at 127.10. The midline at 123.26 sits well below current price. This is another sign that short-term strength has pushed Palantir stock toward the top of its recent range. The hourly ATR14 of 1.50 shows volatility has compressed relative to the daily scale, which is typical after a sharp move.
15-Minute Chart Adds Execution Nuance
Zooming into the 15-minute chart adds useful execution context without being mistaken for a trend signal. Price at 125.91 sits above its EMA20 (125.46), EMA50 (124.49), and EMA200 (124.93) — a fully bullish short-term stack. RSI14 at 59.62 aligns with the hourly reading.
Yet a subtle warning appears here. The 15m MACD histogram has turned slightly negative at -0.08, even though the MACD line (0.52) remains above the signal (0.61) only marginally. That hints the most immediate burst of buying pressure may be pausing. The 15m Bollinger Bands are notably tight — mid at 125.59, upper at 126.28, lower at 124.90 — reflecting the range compression typical after an earnings-driven repricing.
Pivot Levels and the Earnings Catalyst for PLTR
Pivot levels reinforce the near-term tug-of-war in Palantir Technologies Inc. stock. On the daily chart, PP sits at 125.51 with R1 at 127.36 and S1 at 124.06. Price hovers just above the pivot, meaning bulls have a marginal intraday edge but have not cleared meaningful resistance yet. The hourly pivot at 125.86 and the 15m pivot at 125.89 sit essentially at current price. This underscores that PLTR is trading right at a decision point across all three timeframes.
The news backdrop explains why momentum has shifted so quickly. Palantir’s second-quarter results beat expectations, and the company raised its full-year revenue and income guidance. According to Bloomberg, CEO Alex Karp described commercial demand as “otherworldly”. Shares were reportedly active in extended trading following the report. At least one analyst — Gil Luria of D.A. Davidson — called Palantir the “best” publicly traded technology company on the back of these results. That kind of fundamental catalyst can override a bearish daily chart, at least temporarily. It is clearly fueling the divergence between daily and hourly signals.
Bullish and Bearish Scenarios for Palantir Technologies Inc. Stock
The path forward hinges on whether earnings momentum can override the daily bearish structure. Two competing scenarios define the outlook for Palantir stock in the sessions ahead.
What a Bullish Reversal Requires
For the bullish case to gain real traction, price needs to reclaim the daily EMA20 near 126.83 and push through R1 at 127.36 with conviction. A move like that, especially if paired with the daily MACD histogram beginning to narrow toward zero, would start repairing the bearish daily structure. RSI14 climbing back above 50 would add confirmation that the trend is genuinely shifting rather than producing a short-term bounce. Sustained volume on any breakout, echoing the participation seen in the earnings reaction, would add credibility to that shift.
How the Bearish Case Could Reassert Itself
The bearish case remains very much alive. If the hourly momentum stalls — something already hinted at by the softening 15m MACD histogram — price could roll back toward the daily pivot at 125.51 and then toward S1 at 124.06. A failure to hold above the hourly EMA20 at 124.27 would be an early warning that the earnings-driven bounce is fading. In that scenario, the daily downtrend would simply reassert itself. Price, still trading well below the EMA200 at 143.09, could be dragged back toward the lower daily Bollinger Band near 119.47.
Overall, Palantir Technologies Inc. stock is caught between two competing narratives. The daily chart reflects a stock under pressure. The hourly and 15-minute charts reflect a market reacting to genuinely strong fundamental news. Volatility, as measured by the daily ATR14 near 5.92, remains elevated. Swings in either direction should be expected. Given the conflicting signals across timeframes, this looks like a market where positioning discipline matters more than conviction. The next few sessions should clarify whether the earnings catalyst can reverse the broader daily trend or merely produce a short-lived pop within it.
FAQ
Is Palantir Technologies Inc. stock in a bearish or bullish trend right now?
The daily chart shows a clear bearish trend, with PLTR trading below its EMA20, EMA50, and EMA200. However, the hourly chart has turned bullish following strong Q2 earnings, creating conflicting signals across timeframes. The daily structure remains the dominant trend until proven otherwise.
What price levels matter most for Palantir stock after earnings?
Key levels include the daily EMA20 at 126.83 and R1 at 127.36 on the upside. On the downside, the daily pivot at 125.51 and S1 at 124.06 serve as immediate support. The EMA200 at 143.09 represents the major overhead resistance that would need to be reclaimed for a genuine trend reversal.
What did Palantir’s Q2 earnings report reveal?
Palantir beat Q2 expectations and raised its full-year revenue and income guidance. CEO Alex Karp described commercial demand as “otherworldly,” according to Bloomberg. D.A. Davidson analyst Gil Luria called Palantir the “best” publicly traded technology company on the back of these results.
Can the earnings beat reverse Palantir’s daily bearish trend?
It is possible but not yet confirmed. For a genuine reversal, PLTR must reclaim the daily EMA20 near 126.83, push through R1 at 127.36, and see the daily MACD histogram narrow toward zero. Until those conditions are met, the daily bearish structure remains intact, and the bounce may prove temporary.
Disclaimer: This article is for informational purposes only and does not constitute financial advice, an investment recommendation, or a solicitation to buy or sell any financial instrument or cryptocurrency. The analysis provided is not indicative of future results. Investing in crypto assets and financial markets carries a high risk of capital loss. Always do your own research (DYOR) and consult a qualified financial advisor before making any decision.
Article produced with the assistance of artificial intelligence and reviewed by the editorial team.