
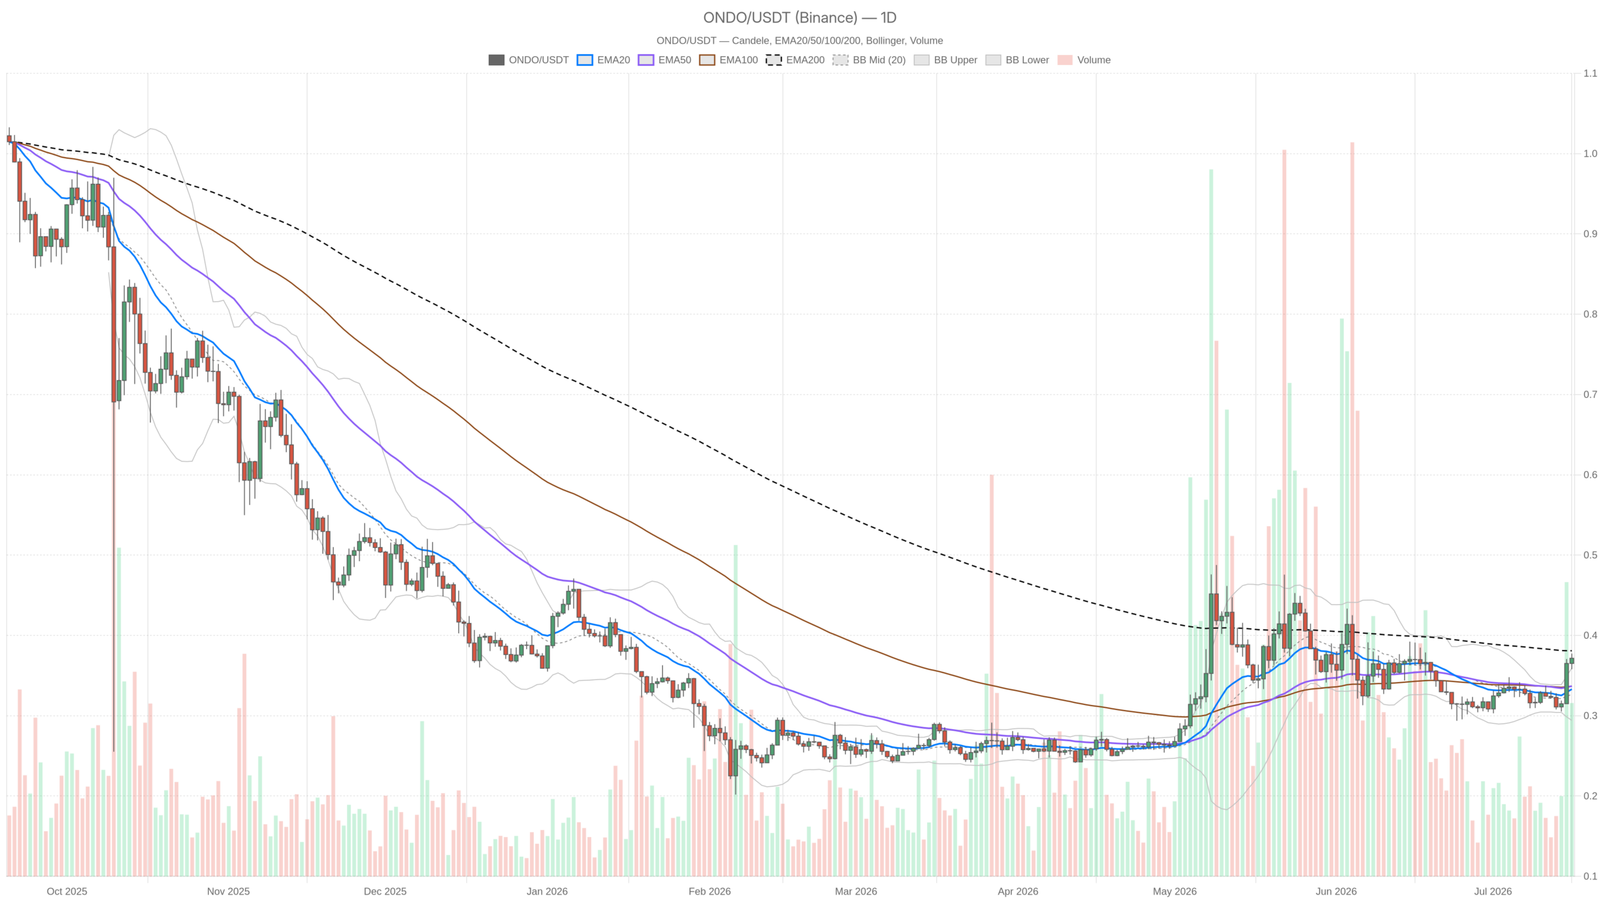
A quiet tension surrounds Ondo crypto as the price settles at $0.37 — precisely on its daily pivot — on July 16, 2026. The short-term structure looks constructive, yet the EMA200 at $0.38 sits just overhead, carrying weight that traders cannot afford to ignore.
Key takeaways
- $ONDO/$USDT trades at $0.37, exactly on its daily pivot point as of July 16, 2026.
- The daily EMA200 at $0.38 is the critical resistance that must break for a confirmed bullish trend.
- The hourly EMA stack is fully bullish, with price above all three key moving averages.
- Market sentiment sits in Extreme Fear territory, with the Fear & Greed Index at 25.
- A daily close above $0.38 would flip the regime from neutral to bullish and shift the risk/reward profile.
Price action at a crossroads as momentum builds beneath heavy resistance
$ONDO sits at a critical juncture where short-term momentum builds beneath structural resistance that has yet to break. $ONDO/$USDT is trading at $0.37, precisely on its daily pivot point — a level that reads less like coincidence and more like the market holding its breath. Price has climbed well above the daily EMA20 at $0.33 and EMA50 at $0.34, with the hourly regime flagged as outright bullish. However, the daily EMA200 at $0.38 sits just one cent above current price, and that single cent carries enormous structural weight.
Moreover, the broader crypto market is not exactly cheering from the sidelines. Total market capitalization sits at approximately $2.29 trillion, down 0.64% in 24 hours according to CoinGecko, with Bitcoin dominance holding firm at 56.17%. More telling is the Fear & Greed Index, which registers a reading of 25 — deep inside Extreme Fear territory. That macro backdrop means any rally in altcoins like $ONDO is swimming against a psychological current, and momentum could reverse fast if broader sentiment deteriorates further.
Daily timeframe: bullish structure meets neutral regime in a telling contradiction
The daily chart presents a mostly positive story beneath a ceiling that refuses to yield. Price at $0.37 trades above both the EMA20 and EMA50, which are themselves in bullish order at $0.33 and $0.34 respectively. This is the kind of structure that trend-followers want to see — short-term averages rising, price leading the way. The problem arrives with the EMA200 at $0.38, currently above price and acting as dynamic resistance. Until $ONDO closes a daily candle above $0.38 with conviction, the macro moving average continues capping upside.
The daily RSI at 64.53 sits in an uncomfortable middle ground. It is warm enough to confirm genuine buying interest and trend participation, yet it is not so extended that an imminent reversal is screaming. Moreover, it does not leave much margin before entering overbought territory above 70. The daily MACD histogram prints a marginal positive value of 0.01 — essentially the momentum engine just barely turning over, not a powerful thrust but a lean in the right direction.
Taken together, these readings suggest the daily timeframe is bullish in character but not yet committed to a breakout. The system’s own classification of the daily regime as neutral is honest: this is a market on the edge of confirming a trend, not one that has already done so.
The Bollinger Bands on the daily add another layer of nuance. The midband sits at $0.33, the upper band at $0.36, and the lower band at $0.29. Current price at $0.37 is trading above the upper Bollinger Band, which in a mean-reversion context would typically signal overextension. However, in trending markets, walking the upper band is normal behavior. The ATR of $0.02 indicates that average daily volatility is relatively contained — meaningful moves happen, but they do not tend to be explosive. That limits both the upside excitement and the downside panic in any given session.
Hourly confirmation and the 15-minute consolidation pattern
The hourly chart confirms a cleaner bullish picture. Price at $0.37 is above all three key EMAs: the EMA20 at $0.36, EMA50 at $0.34, and EMA200 at $0.33. This is a fully aligned bullish EMA stack — every moving average is in order, and price is leading from the front. However, the hourly RSI at 69.39 presses against the overbought threshold, which is a warning flag worth respecting. It means intraday momentum is strong, but buyers who chase here are entering near a zone where exhaustion typically begins.
The hourly MACD histogram is flat at zero, suggesting momentum is neither accelerating nor collapsing — a pause, not a reversal. Meanwhile, the 15-minute chart confirms brief consolidation rather than a breakdown. Price sits exactly on its EMA20 at $0.37, the RSI at 55.8 is neutral, and Bollinger Bands have compressed to a tight range between $0.37 and $0.38.
That compression is the market coiling. It is not predictive of direction on its own, but it does suggest a move is coming. Whatever catalyst pushes price in either direction will likely be amplified by that tightness. The 15-minute frame is essentially in a wait-and-see mode.
The bullish and bearish cases for $ONDO at current levels
The bull case hinges entirely on a clean break above the EMA200 at $0.38 on the daily chart. If $ONDO closes above that level with volume, resistance becomes support and R1 at $0.38 turns into a launching pad rather than a ceiling. A sustained move above $0.38 on the daily would also flip the regime from neutral to bullish.
That shift changes the character of the move from “approaching resistance” to “confirmed breakout.” In that scenario, the upper Bollinger Band at $0.36 and the EMA200 both become floors, tilting risk/reward meaningfully in the bulls’ favor.
Conversely, what invalidates the bull case is a failure to hold $0.36 — the daily S1 pivot and the hourly EMA20. A close below that level would signal that the EMA200 rejection was genuine and the attempted breakout has fizzled. Below $0.36, the next natural magnet is the Bollinger midband at $0.33, which converges with the EMA20. That is a drawdown exceeding 10% from current levels and would likely drag the daily RSI back into neutral territory, resetting the structure.
The bear case does not require a catastrophe — it just needs the EMA200 to do its job. In a market where the Fear & Greed Index sits at 25 and total crypto market cap is softening, altcoins rarely sustain breakouts on sentiment alone. $ONDO has no macro tailwind from the broader market right now, and if Bitcoin dominance continues to climb or total market cap fades further, risk-off behavior will hit mid-cap altcoins disproportionately hard.
Positioning context: where risk lives in the current setup
Reading across all three timeframes, the dominant narrative for Ondo crypto is a controlled bullish push into heavy overhead resistance with insufficient macro support to make the breakout easy. The hourly is bullish, the 15-minute is coiled, and the daily is one candle away from either confirming or denying a meaningful trend. That is not a setup that rewards aggressive entries — it rewards patience.
Traders already long from lower levels face a straightforward question: is $0.38 worth defending a full position through, or does it make sense to take partial profits at the EMA200 and reassess? Those without a position are in a more interesting spot. Waiting for the EMA200 to either break cleanly or reject definitively gives a far higher-quality entry in either direction than chasing the current equilibrium. The ATR of $0.02 on the daily means false breaks happen within normal volatility, so a single candle close above $0.38 is not enough — ideally, two consecutive daily closes above that level would carry real weight.
Volatility, while not extreme, is present. The Fear & Greed reading of 25 means the market is sensitive and prone to sharp moves on relatively minor catalysts. Position sizing matters here more than directional conviction — the structure is genuinely uncertain at this juncture. What the data does tell us is where the key levels are, what would confirm each scenario, and how much room exists before the picture changes materially. The rest is execution.
FAQ
What is the key resistance level for $ONDO right now?
The daily EMA200 at $0.38 is the critical resistance that has capped upside so far. A clean break above this level with volume would be required to confirm a bullish trend reversal on the daily timeframe.
Is the trend for $ONDO currently bullish or bearish?
The daily structure is bullish in character — price trades above both the EMA20 and EMA50 — but the regime remains classified as neutral because the EMA200 at $0.38 is still acting as overhead resistance. Until that level is broken, the trend has not been confirmed.
What would confirm a breakout for $ONDO?
Two consecutive daily closes above $0.38 would provide meaningful confirmation. A single candle close above the EMA200 is not sufficient given the ATR of $0.02, which means false breaks can occur within normal daily volatility.
What invalidates the bullish case?
A daily close below $0.36 — the S1 pivot and hourly EMA20 — would signal that the EMA200 rejection was genuine. Below that level, the next support zone is the Bollinger midband at $0.33, converging with the daily EMA20.
Disclaimer: This article is for informational purposes only and does not constitute financial advice, an investment recommendation, or a solicitation to buy or sell any financial instrument or cryptocurrency. The analysis provided is not indicative of future results. Investing in crypto assets and financial markets carries a high risk of capital loss. Always do your own research (DYOR) and consult a qualified financial advisor before making any decision.
Article produced with the assistance of artificial intelligence and reviewed by the editorial team.