
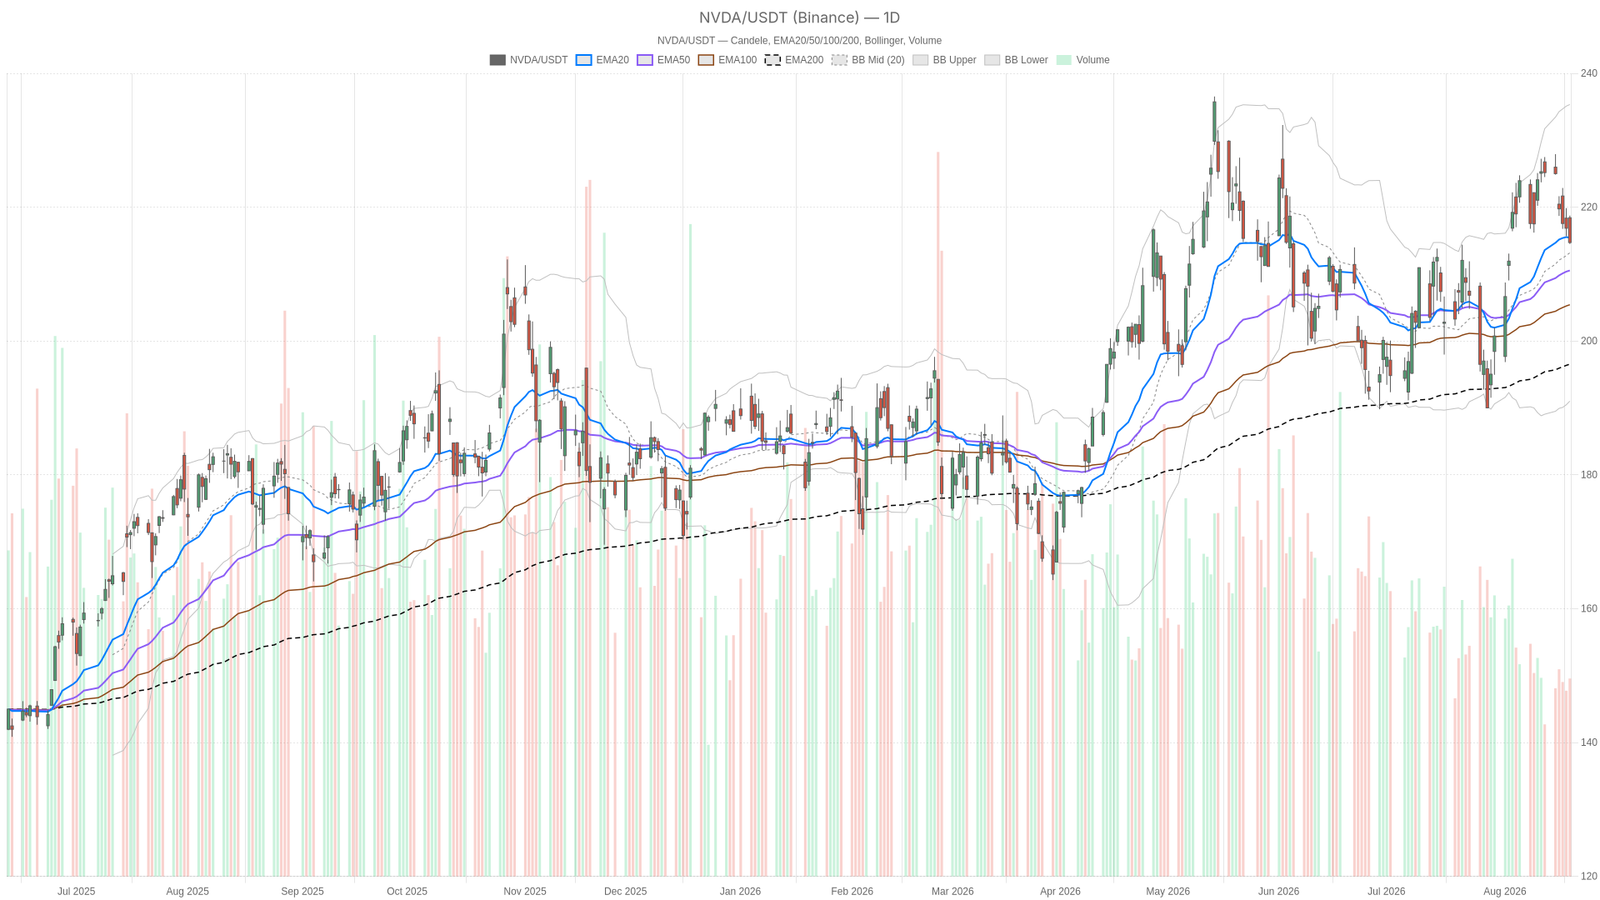
NVIDIA Corporation stock closed at $214.72, holding above the 50-day and 200-day EMAs. The daily uptrend remains intact. However, short-term momentum has softened markedly, creating a tense technical divergence ahead of the upcoming earnings report.
Key takeaways
- NVDA closed at $214.72, above the 50-day EMA ($210.54) and 200-day EMA ($196.54), keeping the long-term uptrend intact.
- Daily MACD has crossed bearishly, producing a negative histogram of -0.40, signaling fading momentum despite the intact trend.
- The 1-hour chart shows a bearish EMA stack with RSI14 at 32.90, confirming short-term weakness within the broader uptrend.
- Analysts flag sky-high earnings expectations, with downside risk toward the $190 support zone if key levels fail.
- With daily ATR14 at 5.75, NVDA is primed for outsized moves around the upcoming earnings catalyst.
NVDA Daily Trend: Structure Still Bullish as Momentum Fades
The daily trend remains structurally bullish, with NVDA holding above the 50-day EMA at $210.54 and the 200-day EMA at $196.54. Momentum, however, has begun to deteriorate. Price closed at $214.72, just below the 20-day EMA at $215.45, after a session range between $214.50 and $218.74.
RSI14 sits at 51.01, a neutral reading showing neither strong buying nor selling pressure. Meanwhile, MACD tells a more concerning story. The MACD line at 3.65 has crossed below its signal at 4.06, producing a negative histogram of -0.40. That is a classic early warning of fading bullish momentum, even as the broader trend holds.
Bollinger Bands show price near the midline at $213.18, with the upper band at $235.34 and the lower band at $191.02. The width of that range signals elevated volatility, confirmed by an ATR14 of 5.75. The daily pivot sits at $215.99, with support at $213.23 and resistance at $217.47. Overall, the daily regime registers as neutral, fitting a market digesting gains rather than reversing.
1-Hour Chart Confirms Short-Term Weakness in NVDA
The 1-hour timeframe confirms the short-term momentum weakness. Price at $214.75 sits below both the 20-hour and 50-hour EMAs. It does, however, remain above the 200-hour EMA at $213.28. That stacking—price under the shorter EMAs but above the longer one—is a textbook pullback inside a larger uptrend. RSI14 at 32.90 on this timeframe approaches oversold territory, confirming sellers’ control of recent hourly action.
MACD on the 1H chart is negative, with the line at -1.65 against a signal of -1.62. The histogram has nearly flattened at -0.03, which matters. It suggests the bearish momentum, while present, may be losing its own force. Price trades near the lower Bollinger Band at $213.73 and the midline at $216.96. That positioning often precedes either a bounce or a breakdown. The hourly pivot at $214.93 sits essentially where price trades now, with support at $214.38 just below. In short, the 1H chart confirms the daily momentum warning.
15-Minute Chart: Bearish Regime Holds in a Tight Range
The 15-minute chart shows a fully bearish regime, with all three EMAs stacked against price. NVDA at $214.75 trades below the 20-period EMA ($215.45), the 50-period EMA ($216.37), and the 200-period EMA ($219.46). This confirms that short-term sellers remain firmly in control at the intraday level. RSI14 at 40.37 supports that reading without being extreme.
MACD on the 15m chart is essentially flat, with both the line and signal at -0.38 and a histogram of zero. Therefore, downside momentum at this granular level appears to be stalling rather than accelerating. Price hugs the lower Bollinger Band at $214.59 against a midline of $215.51. ATR14 has compressed to just 0.54, reflecting a tight, low-volatility range. Notably, price sits almost exactly on the 15m pivot point of $214.93, with immediate support at $214.38. This is a market in a holding pattern, waiting for a catalyst.
The Core Tension: Trend Versus Momentum in NVIDIA Corporation Stock
The core tension in NVIDIA Corporation stock is straightforward. The daily structure—price well above the 50- and 200-day EMAs—keeps the long-term uptrend alive. At the same time, both the 1H and 15m timeframes show momentum breaking down. EMAs are stacked bearishly on lower timeframes. Meanwhile, RSI is drifting toward oversold on the hourly chart. This is not a full trend reversal signal yet. Instead, it looks like a controlled pullback within a larger uptrend, though one that must hold key support levels to remain that way.
Adding to the complexity, a Seeking Alpha preview ahead of earnings notes that expectations are sky-high. Options and technical signals show capped upside alongside sharp downside risk toward the $190 support zone. That external view lines up with the technical picture. Upside from here may be limited unless earnings genuinely surprise, while downside risk becomes real if support gives way.
Bullish Scenario: What NVIDIA Corporation Stock Bulls Need to See
For the bullish case to reassert itself, bulls need price to hold above daily support at $213.23 and the 50-day EMA at $210.54. A reclaim of the daily pivot at $215.99 and the 20-day EMA at $215.45 would be an early sign that buyers are stepping back in. Confirmation would come from the MACD histogram turning positive again and RSI14 pushing back above the 50–55 zone across both daily and hourly timeframes.
Fundamental Catalysts Supporting the Thesis
From a fundamental standpoint, the bullish narrative is well supported. The Motley Fool argues NVIDIA remains the top semiconductor stock for years to come, thanks to its dominant AI ecosystem. Jim Cramer has continued to back the company, framing it as central to an ongoing industrial revolution. This comes even after a relatively lukewarm 2026 that still left shares up 13.7% year-to-date. A strong earnings beat that addresses margin concerns could reignite the move toward the upper Bollinger Band near $235.34.
Bearish Scenario: What Would Invalidate the Bullish Case for NVDA
The bearish path becomes more credible if price breaks below the 1H lower Bollinger Band at $213.73. A close below daily support at $213.23 would add further weight. A confirmed close under the daily 50-EMA at $210.54 would be a more serious signal. That would open the door toward the $190 support zone flagged in the Seeking Alpha earnings preview. Sky-high expectations heading into the print raise the risk of a “beat but sell” reaction, a dynamic explicitly warned about in that report.
Cost Pressures and Demand Risks
Separately, Bloomberg and CNBC both reported a notable development. NVIDIA has told some of its largest customers that server prices containing its AI chips could rise more than 15%. The increase is driven by soaring memory chip costs. That detail is worth watching closely. Rising input costs passed on to customers could eventually pressure demand assumptions if the market starts questioning margin durability.
Overall Outlook for NVIDIA Corporation Stock
Overall, NVIDIA Corporation stock remains structurally bullish on the daily chart. Short-term momentum, however, has clearly cooled, and the hourly and 15-minute timeframes are flashing caution. Volatility is likely to stay elevated given the daily ATR14 reading of 5.75 and the looming earnings report. That catalyst historically produces outsized moves in this name. At the same time, the market appears to be in a genuine wait-and-see mode, compressed into a tight range on the shortest timeframe. Positioning around the current pivot zone, near $213 to $216, carries real two-way risk. The coming earnings print will likely determine whether the pullback resolves as a buying opportunity or the start of a deeper corrective move.
FAQ
What key levels should traders watch for NVIDIA Corporation stock?
The most critical levels are daily support at $213.23 and the 50-day EMA at $210.54 on the downside. On the upside, the daily pivot at $215.99 and the 20-day EMA at $215.45 are the first hurdles. A close below $210.54 would open the door toward the $190 support zone, while a reclaim above $215.99 would signal buyers regaining control.
Is the long-term uptrend in NVIDIA Corporation stock still intact?
Yes. Price at $214.72 remains comfortably above the 50-day EMA ($210.54) and 200-day EMA ($196.54). The daily structure has not broken down. The current weakness is concentrated on the 1-hour and 15-minute timeframes, suggesting a pullback within the broader uptrend rather than a full reversal.
What could trigger a bearish breakdown in NVDA?
A confirmed close below the daily 50-EMA at $210.54 would be the most important bearish signal. That would likely open the path toward the $190 support zone identified in recent analyst previews. Additionally, sky-high earnings expectations raise the risk of a negative reaction even on decent results, a dynamic known as a “beat but sell” scenario.
Disclaimer: This article is for informational purposes only and does not constitute financial advice, an investment recommendation, or a solicitation to buy or sell any financial instrument or cryptocurrency. The analysis provided is not indicative of future results. Investing in crypto assets and financial markets carries a high risk of capital loss. Always do your own research (DYOR) and consult a qualified financial advisor before making any decision.
Article produced with the assistance of artificial intelligence and reviewed by the editorial team.