
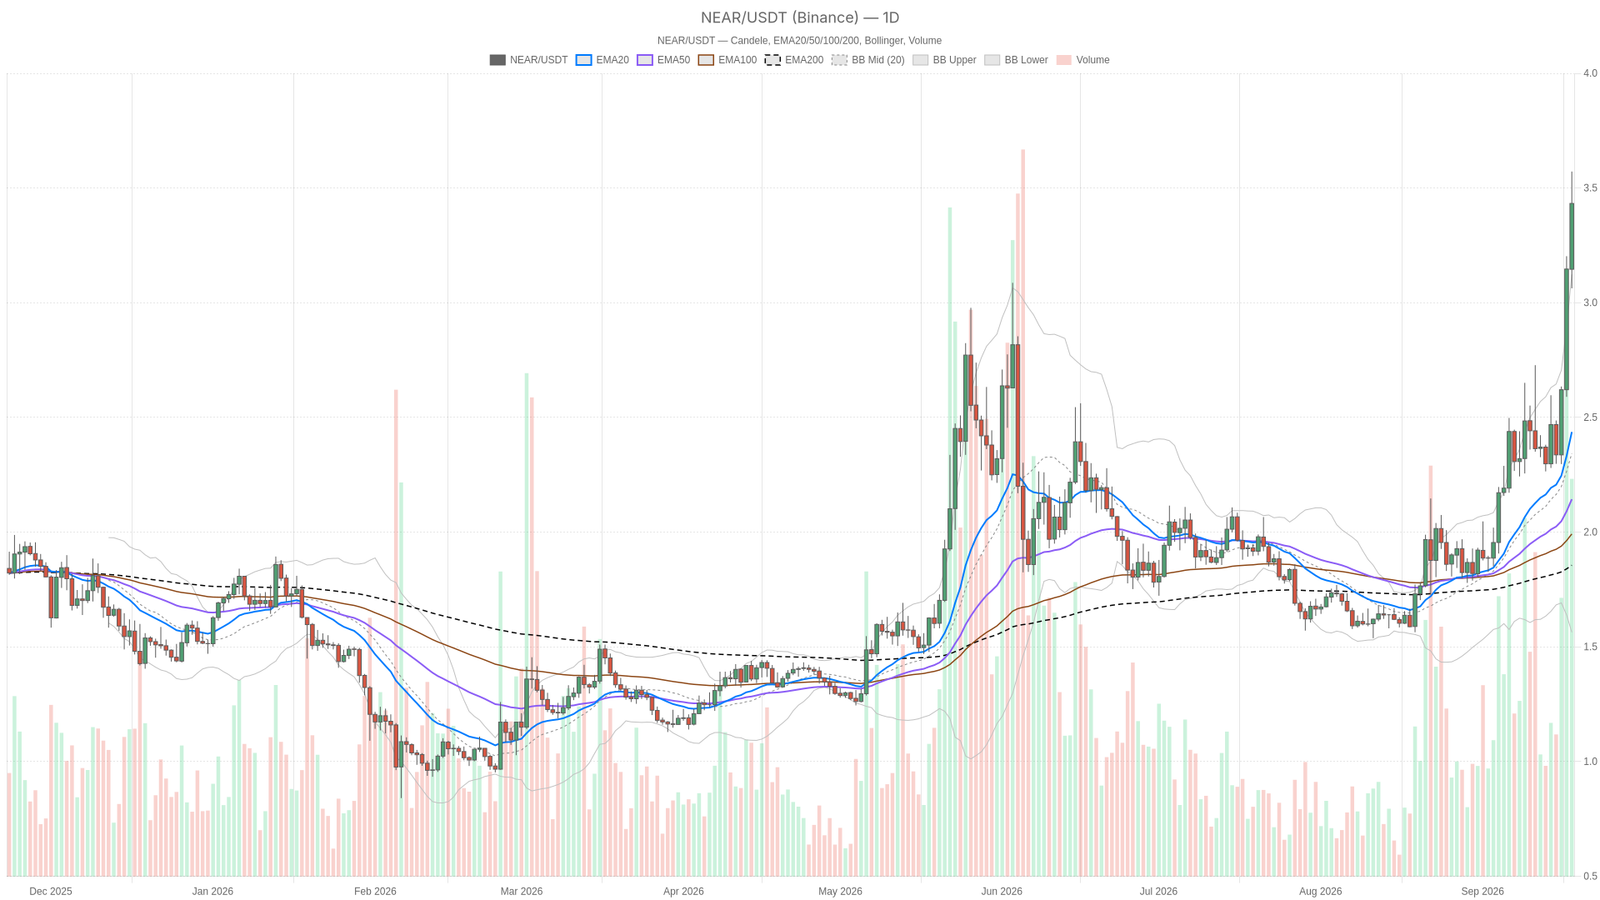
The cryptocurrency market often rewards patience, and for $NEAR Protocol crypto traders, that moment has arrived. As of September 18, 2026, NEARUSDT trades around $3.43 — firmly above all major daily moving averages — yet overbought signals suggest caution is warranted.
Key takeaways
- NEARUSDT at $3.43 sits above EMA20 ($2.44), EMA50 ($2.14), and EMA200 ($1.86) on the daily chart
- Daily RSI14 at 80.09 signals deep overbought conditions
- $NEAR Intents fees jumped 126.23% in 24 hours and 275.19% over 30 days
- THORSwap DEX aggregator fees surged 2,787.69% in a single day
- Fear & Greed Index at 56 (Greed) reflects moderate risk appetite
Daily Chart Shows a Stretched Uptrend
The daily chart shows NEARUSDT in a strong uptrend with price well above all major moving averages, though overbought readings warn the move has extended too far, too fast. The structure is unambiguously bullish.
Price at $3.43 trades above the EMA20 at $2.44, EMA50 at $2.14, and EMA200 at $1.86. This is the textbook signature of an established uptrend rather than a choppy range. The problem, however, is how far price has run relative to those averages — a sharp extension, not a gentle climb.
RSI14 on the daily sits at 80.09, deep into overbought territory. This reading does not necessarily mean sell now. It does signal, however, that the move is vulnerable to a sharp mean-reversion if buyers hesitate even briefly. MACD remains constructive, with the line at 0.28 above the signal at 0.19. A positive histogram of 0.09 confirms bullish momentum for now.
Price has pushed through the upper Bollinger Band at $3.12, while the mid-band sits at $2.34 and the lower band at $1.56. This points to a stretched, volatility-expansion move. ATR14 at 0.28 confirms daily ranges have widened considerably. The daily pivot sits at $3.36, with resistance at $3.65 (R1) and support at $3.14 (S1). Both are useful markers for where this move could either extend or snap back.
Hourly Momentum Is Cooling Down
The hourly chart confirms the broader bullish structure but reveals visibly weakening momentum, as the MACD histogram shrinks to near zero. Price at $3.44 remains above the EMA20 at $3.24, EMA50 at $2.95, and EMA200 at $2.58, keeping the uptrend intact.
RSI14 at 72 is still elevated, though not as extreme as the daily reading of 80. This suggests some of the heat is starting to come off at the shorter-term level. Meanwhile, the MACD histogram has shrunk to just 0.01, with the MACD line at 0.19 barely above the signal at 0.18. That is momentum losing steam, not reversing outright — a subtle but important distinction.
The hourly Bollinger Bands show price back inside the band rather than riding the outer edge. The mid-band sits at $3.21, the upper band at $3.66, and the lower band at $2.75. This is consistent with a market consolidating after an aggressive push. The 1H pivot at $3.44 lines up almost exactly with current price. Resistance sits at $3.48 (R1) and support at $3.40 (S1), forming a tight range that will likely decide the next short-term move.
15-Minute Chart Points to Short-Term Indecision
The 15-minute chart reveals a neutral, directionless market that is simply consolidating after the recent push higher. RSI14 at 51.44 sits at the midpoint, showing no directional conviction either way at this granularity.
The MACD histogram has flipped slightly negative at -0.02, with the MACD line at 0.03 dipping just under the signal at 0.05. This represents a small, short-lived momentum stall rather than anything structural. Moreover, price at $3.43 trades just under the EMA20 at $3.45 but above the EMA50 at $3.33 and well above the EMA200 at $2.93.
Price is hugging the lower Bollinger Band at $3.42 versus the mid-band at $3.47 and upper band at $3.53. This is classic execution-level noise — a market catching its breath inside a tight range. The range is bounded by the 15m pivot at $3.45, resistance at $3.46, and support at $3.42.
Bullish and Bearish Scenarios
The bullish case rests on the daily trend reasserting itself once the overbought condition resolves through time rather than price decay. If NEARUSDT holds above the hourly support zone near $3.40–$3.44 and MACD momentum on the 1H reaccelerates, a push toward the daily R1 at $3.65 becomes the logical next target.
The stretched Bollinger Band structure argues for continued volatility expansion rather than a hard reversal. This scenario, however, would be invalidated by a daily close back below the $3.36 pivot. That would suggest the extension has failed and buyers could not defend the breakout.
The bearish, or more accurately mean-reversion, scenario centers on that daily RSI of 80 and price sitting outside the upper Bollinger Band. If short-term support around $3.40–$3.42 gives way, the more natural pullback targets become the daily EMA20 near $2.44 or the Bollinger mid-band at $2.34. That is a meaningful retracement given how far price has run above its own averages.
Conversely, the bearish case would be invalidated if price reclaims and holds above the daily R1 at $3.65 without RSI showing negative divergence. That would signal the trend still has real fuel left rather than just momentum exhaustion.
On-Chain Activity and Market Context
The broader cryptocurrency market is not offering much of a tailwind or headwind either way. Total market capitalization sits around $2.687 trillion, down a modest 0.27% over 24 hours, with Bitcoin dominance at 58.15%, according to aggregated market data.
What is more interesting is the on-chain activity surrounding $NEAR Protocol crypto. DeFi fee data shows $NEAR Intents fees up 126.23% in the last day, 101.24% over seven days, and 275.19% over 30 days. Rhea Dex fees are up 20.47% daily, 82.51% weekly, and a striking 2,325.84% over the past month.
THORSwap, a DEX aggregator active on the network, saw fees jump 2,787.69% in a single day. The Fear & Greed Index reads 56, classified as Greed, which points to moderate risk appetite rather than euphoria. That kind of surge in transaction activity and fee generation across the ecosystem’s bridge and DEX infrastructure lines up with the price strength. However, a spike of that magnitude in such a short window should be read as a signal of unusually high activity rather than a guarantee it repeats.
Positioning and Risk Management
Putting it together, the daily trend is strong but stretched, the hourly chart is still bullish yet visibly losing momentum, and the 15-minute chart remains essentially directionless. That is not a contradiction. It is a market digesting a big move — the kind of setup where being early to either side of the trade carries real risk.
Volatility, as measured by ATR across all three timeframes, has expanded meaningfully. Whatever happens next is likely to happen quickly rather than gradually. Anyone tracking this pair should watch the $3.40–$3.48 hourly range closely. How that zone resolves will likely determine whether the next move is a continuation toward daily resistance levels or a deeper retracement back into the mid-$2 range.
Given the overbought daily RSI and the ecosystem’s outsized recent fee growth, this looks less like a moment for conviction and more like one for patience and clearly defined levels.
FAQ
What does the daily RSI at 80.09 mean for NEARUSDT?
An RSI above 70 signals overbought conditions. At 80.09, NEARUSDT is deep in overbought territory, suggesting the rally has extended itself and is vulnerable to a pullback or consolidation. However, it does not guarantee an immediate reversal.
Why did on-chain fees surge so dramatically on $NEAR Protocol?
$NEAR Intents fees rose 126.23% in 24 hours and 275.19% over 30 days, while THORSwap fees jumped 2,787.69% in a single day. These spikes reflect unusually high transaction and bridge activity, which aligns with the price rally but should be viewed as exceptional rather than sustainable.
What are the key support and resistance levels to watch?
The hourly range between $3.40 and $3.48 is critical for the short term. On the daily chart, support sits at $3.14 (S1) and the pivot at $3.36, while resistance stands at $3.65 (R1). A break below $3.40 could open the door to the daily EMA20 near $2.44.
Disclaimer: This article is for informational purposes only and does not constitute financial advice, an investment recommendation, or a solicitation to buy or sell any financial instrument or cryptocurrency. The analysis provided is not indicative of future results. Investing in crypto assets and financial markets carries a high risk of capital loss. Always do your own research (DYOR) and consult a qualified financial advisor before making any decision.
Article produced with the assistance of artificial intelligence and reviewed by the editorial team.