
After surpassing the 200-day moving average and, crucially, staying above it throughout the ensuing correction, $XRP generated one of its most obvious bullish reversal signals of 2025. Although the initial rally has subsided, the technical framework that remains is significantly more robust.
Sellers don't have enough volume
After an explosive move from about $1.00 to a peak close to $1.70, $XRP is currently trading around $1.39. At first, the increase appeared susceptible to turning into yet another brief surge, especially after $XRP swiftly pulled back from $1.50. Sellers haven't been able to push the asset below its long-term trend indicator, though.
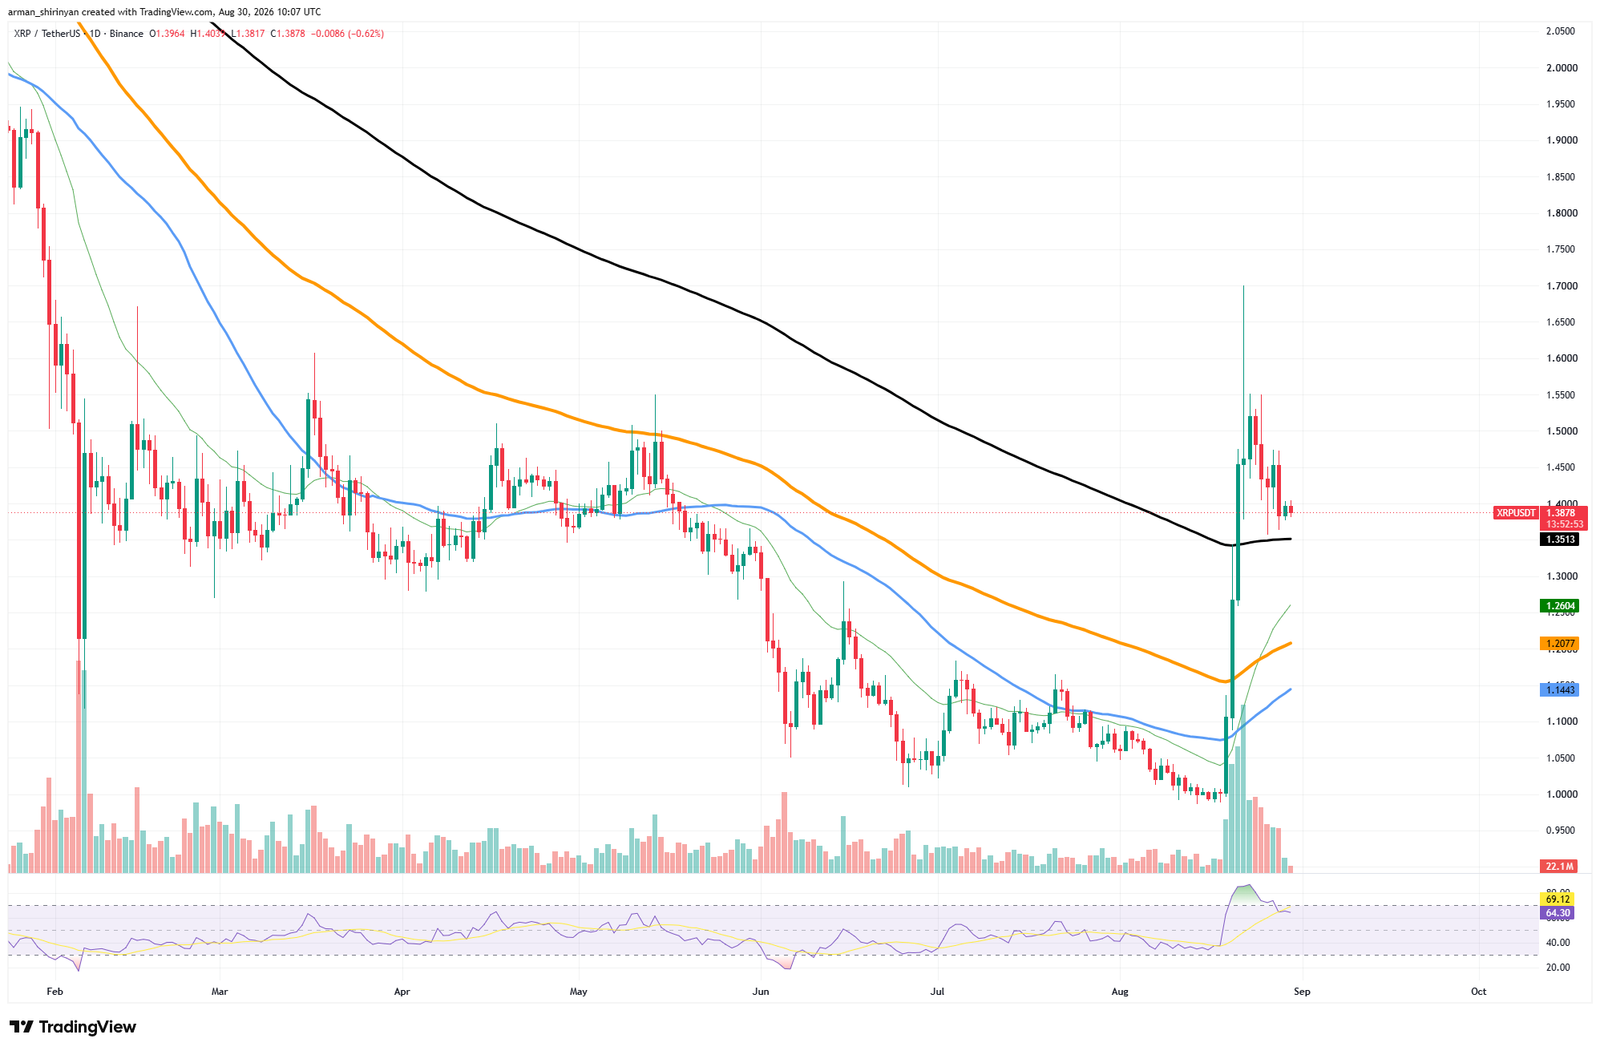
Bears are uncapable of pushing $XRP out of the bullish trend, suggests the descending volume profile. Usually, when corections are followed by the decreasing volume pattern, bears rarely create a foundation for a proper reversal downwards.
The configuration is drastically altered when that same indicator turns into possible support. The rally is also starting to affect the shorter averages. The 50-day and 100-day moving averages are around $1.14 and $1.21, respectively, while the 20-day EMA has risen to roughly $1.26.
Breakout turns long-term
Rather than being a singular price spike, their upward movement indicates that the breakout is starting to impact the broader trend. At the same time, momentum is cooling. During the initial surge, the RSI moved deep into overbought territory and has since dropped to about 65. While maintaining bullish momentum, this eases some of the overheating. $1.35 is the immediate level to defend.
The reversal thesis would be undermined by a prolonged decline below the 200-day average, which could push $XRP toward $1.26–$1.20. The focus returns to $1.45–$1.50 if $1.35 holds. The recent highs would come back into focus if that area were reclaimed, with $1.70 serving as the primary breakout target.
$XRP doesn't require a second vertical move right away. Perhaps a more significant indication that the broader trend has finally shifted would be maintaining the 200-day moving average as support.