
Monero price prediction for October stays bullish above $545, the support $XMR needs to hold to keep its climb from the summer lows on track toward its September high.
Monero Price Analysis: Can $XMR Reach $630 in October?
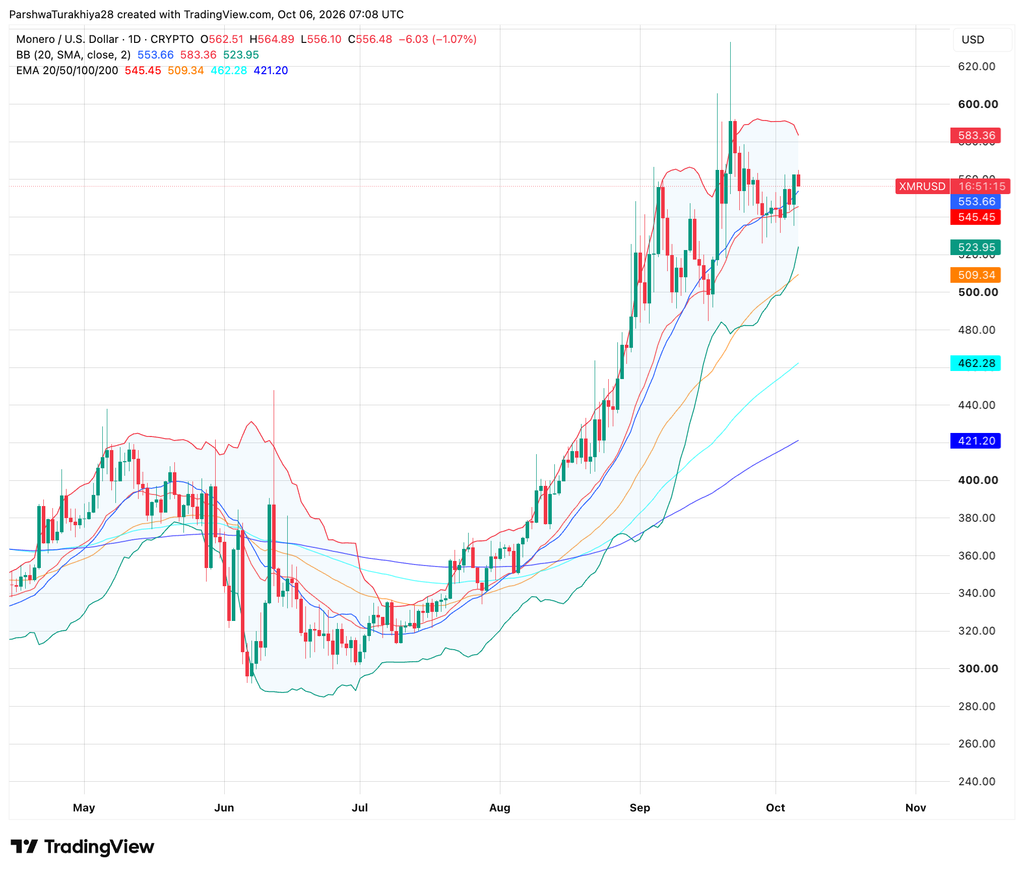
$XMR trades near $556, down 1.07% today, and can reach its September high near $630 if it first clears $565, the top of today’s range, and the $583 upper Bollinger Band. Price spiked to about $630 around September 21, pulled back to roughly $525 in late September and has since bounced to the $556 to $565 area.
Know when your
coins move
Alerts, real-time prices, and market news — all in one app
4.8 based on 40K reviews in the App Store and Google Play
Support starts at the 20-day EMA at $545.45, followed by the $525 pullback low and the 50-day EMA at $509.34. Price sits above all four moving averages, which rise in order from the 200-day at $421.20 to the 20-day, so a dip toward $545 would fit the trend and not signal a turn.
Related: Bitcoin Price Prediction: $87K Remains in Sight After Strive’s Biggest Buy in Four Months
$XMR Support and Resistance Levels for October 2026
Monero October Seasonality: Eight Gains in 12 Years, Including the Last Seven
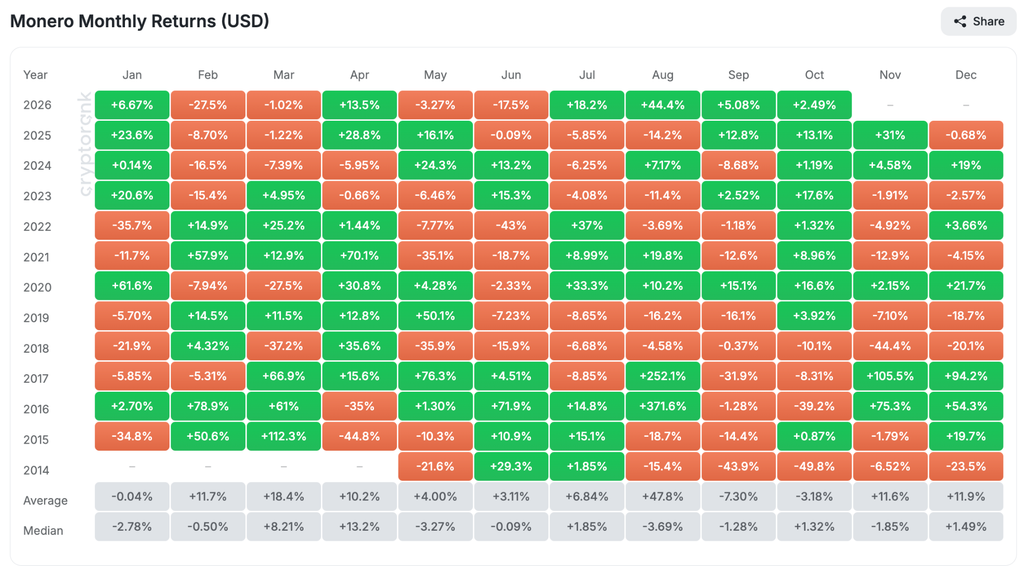
$XMR has closed October higher in eight of the 12 completed years since 2014, including each of the last seven, with an average loss of 3.65% and a median gain of 1.26%. Drops of 49.8% in 2014 and 39.2% in 2016 drag the average down, so the median is the better guide, and the best recent Octobers were 17.6% in 2023 and 16.6% in 2020.
Related: Polkadot Price Prediction October 2026: Can DOT Build on a 45.4% September Surge?
September’s 5.08% gain beat a September median loss of 1.28% and extended a run of green months that began in July at 18.2% and included 44.4% in August. Applied to $556.48, the median October return implies about $563 and the average about $536, both historical references rather than targets, and with 2.49% already booked this month they likely overstate the upside.
$XMR News: Peter Brandt Names Monero His Favorite Chart
$XRP
— The Factor Report (@PeterLBrandt) October 6, 2026
Excuse the rant I am about to unleash
I believe in a concept called "measured moves"
Targets or objectives are not sacred
Charts often fail to deliver what we first identify and morph into something else
I have identified a C&H in $XRP
On a larger time frame this C&H might… pic.twitter.com/o695MCEXHB
Trader Peter Brandt, who posts as The Factor Report, wrote on X that Monero is “my favorite by far” among the charts he compared, a group that also included Solana, Ethereum and Stellar. His reasoning is that $XMR has already worked through the holders who bought at higher prices and may sell when price returns, which he calls absorbed supply, while $XRP still has a large amount of it overhead.
Brandt says he trades price only and does not know Monero’s fundamental story, so the call is a chart read and not a view on the project itself. The post also promotes a $97 trial of BitcoinLive, the paid service he writes for.
Monero Derivatives: Trading Volume Jumps 57.95% as Open Interest Stays Flat
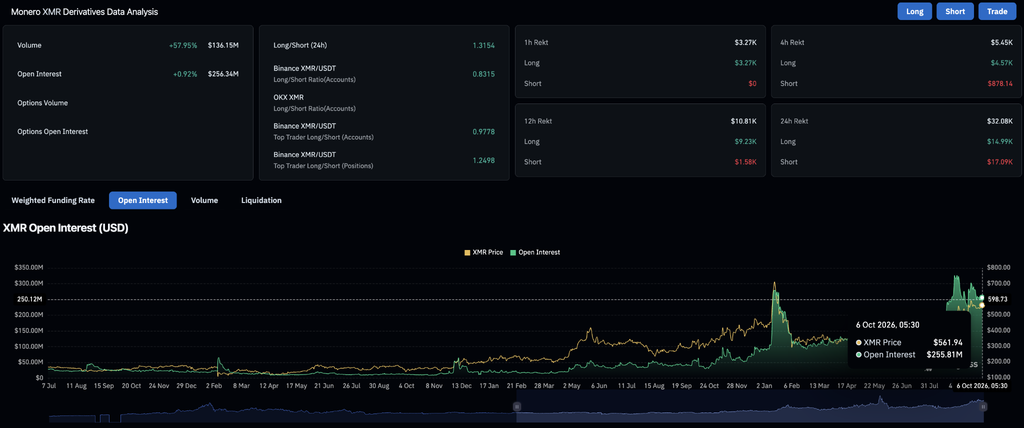
$XMR futures trading jumped 57.95% to $136.15 million over the past day, but open interest, the total value of bets still open, rose only 0.92% to $256.34 million, so traders are mostly swapping positions rather than adding new money. Forced closures, called liquidations, were small at $32.08K and split almost evenly between bets on a drop and bets on a rise. Sentiment is mixed, with Binance showing about eight long accounts for every ten short, although its largest traders lean long.
Monero Price Prediction for October 2026: Where Could $XMR Trade Each Week?
Monero Price Prediction for October: Can $XMR Reach $630 or Fall to $509?
Bullish Case, Target: $630
$XMR holds the 20-day EMA at $545.45, closes a day above $565 and then clears $600, which opens the $630 September high. Rising open interest alongside the move would show new money behind it.
Bearish Case, Risk Level: $509.34 (50-Day EMA)
$XMR loses the 20-day EMA at $545.45 and the $525 pullback low, which would end the recovery from the late-September low. A daily close below the 50-day EMA at $509.34 would expose the 100-day EMA at $462.28.
Related: Avalanche Price Prediction October 2026: Can AVAX Reach $13 or Fall to $9 in October?
FAQs: $XMR Outlook for October 2026
What is the Monero price prediction for October 2026?$XMR could extend toward $600 and then $630 in October if it holds above $545 and closes above $565. A daily close below the 50-day EMA at $509.34 would put the 100-day EMA at $462.28 in play.
Will Monero reach $700 or $1,000 in October?$700 would need a gain of about 26% from $556.48, more than any October in CryptoRank’s table, where the best was 17.6% in 2023, measured on monthly close, and $XMR would first have to clear the $630 September high. $1,000 would need about 80%, and nothing on the chart supports it.
Could Monero fall below $500 in October?Yes, if it loses the 20-day EMA at $545.45 and the $525 pullback low. $500 is a drop of about 10%, which three of the 12 completed Octobers roughly matched or beat, in 2014, 2016 and 2018, and the 50-day EMA at $509.34 sits just above it.
How has Monero performed in October historically?$XMR closed October higher in eight of 12 completed years from 2014 through 2025, including the last seven, with an average loss of 3.65% and a median gain of 1.26%. The 2014 and 2016 drops of 49.8% and 39.2% pull the average below zero.