
- Solana ($SOL) is currently hovering around the $76 mark.
- The momentum creates a temporary split between short-term and long-term indicators.
Solana ($SOL) is currently hovering in a defined range around $76.08, caught between buying at lower levels and seller resistance up top. In addition, the trading volume has jumped over 38% to $1.53 billion, reflecting heightened market participation.
Over the past 24 hours, the price remained confined within a daily low of $75.51 and a high of $77.10. Every pullback to $75 meets immediate demand, while rallies approaching $77 continue to trigger short-term profit-taking. Below the surface, $SOL is printing a falling wedge pattern following its recent pullback.
Rather than signalling seller dominance, the persistent defence of elevated demand zones demonstrates supply absorption. Moreover, the demand is continuously absorbing incoming supply, and consecutive retests of the wedge’s upper trendline suggest overhead pressure is depleting.
Looking at the recent price chart, a confirmed breakout of $SOL above the $77.58 resistance would happen if the bulls strengthened. Upon the emergence of the golden cross, the asset’s price could move higher to the $78 threshold.
On the bearish side, failing to hold the $76 risks a breakdown initially toward the support at around $75.29. Further correction on the downside might push the Solana price to test the potential $74.11, along with the formation of the death cross.
What Does Solana’s Technical Analysis Suggest?
The four-hour technical setup exhibits that the Moving Average Convergence Divergence has crossed above zero. The short-term price momentum has surged upward. Notably, the signal line remains negative. This shows that the $SOL market is undergoing a rapid, aggressive shift in momentum, creating a temporary split between short-term and long-term indicators.
Instead of a gradual recovery, buyers stepped in aggressively at lower support levels. The overall momentum is rapidly shifting back into the bulls’ favour. While the lag of the signal line reflects recent market weakness, the rapid upward cross of the MACD hints that buyers are aggressively driving the immediate recovery.
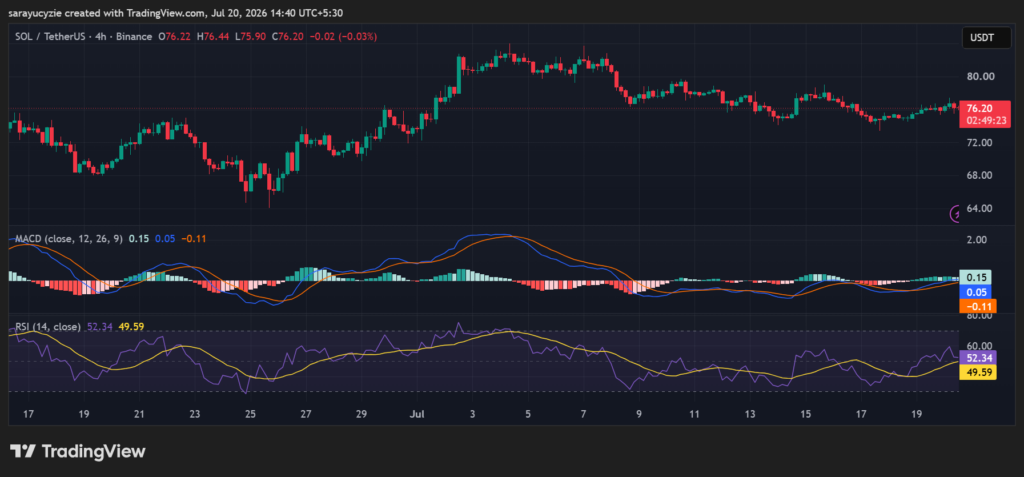
Furthermore, the daily Relative Strength Index (RSI) is settled at 52.34, signalling a neutral-to-slightly-bullish equilibrium. This reading indicates that buying pressure marginally outweighs selling pressure, but neither side holds decisive control. The market is in a structural holding pattern.
Price action moves sideways or within a tight, controlled channel as the market establishes value at current levels. The indicator is providing equal room to climb toward overbought territory or slide toward oversold levels. It represents a reset zone, with a balanced market.