
Mantle price has climbed about 13% over the past seven days to trade near $0.46 on August 13, extending its recovery from the lows recorded earlier this month.
According to CoinGecko data, $MNT was trading around $0.46 at the time of writing, up about 5.5% over the previous 24 hours and 13.2% over seven days.
$MNT has risen from around $0.40 earlier this week, reaching nearly $0.47 during trading on August 13.
The rally has developed alongside renewed attention on Mantle’s real-world asset strategy, which has increasingly focused on bringing tokenized financial products and capital market assets onchain.
Crypto researcher Stacy Muur said she reviewed Mantle’s RWA data, major products, lending markets and treasury strategy to assess how the ecosystem has developed.
Her research has put fresh attention on Mantle’s efforts to build an onchain market around tokenized assets rather than depending only on activity generated by its Layer 2 network.
Mantle has been developing several parts of that strategy, including products tied to tokenized traditional assets and infrastructure designed to move capital between onchain markets.
Another catalyst arrived this week when Mantle announced that tokenized exposure to Jersey Mike’s $7.3 billion listing had gone live on the network.
In an August 11 announcement, Mantle described the Jersey Mike’s listing as the largest US consumer initial public offering of 2026.
The tokenized asset, known as JMKEx, gives eligible users blockchain-based exposure to the newly listed company through Mantle.
xStocks tokenized the asset, while trading is available around the clock through Fluxion using its Atomic RFQ and automated market maker infrastructure.
The launch connects Mantle’s RWA strategy with a newly listed US equity at a time when tokenized stocks have become a more active part of crypto market development.
Mantle also said additional major listings were expected to arrive later in 2026, potentially expanding the range of traditional market assets available through the network.
Price action strengthened alongside those developments. According to CoinGecko, $MNT traded near $0.40 on August 7 before climbing above $0.41 and $0.42 and reaching roughly $0.43 on August 8.
After spending much of August 9 and August 10 between approximately $0.42 and $0.43, $MNT accelerated on August 11 and briefly moved above $0.45.
A pullback followed on August 12, taking the token back toward $0.43 before buyers returned.
$MNT extended its rally on August 13, climbing toward $0.47 before pulling back slightly to around $0.46 at the time of writing.
Whether $MNT can turn the rally into a larger recovery now depends on its ability to hold the levels reclaimed during the latest breakout.
$MNT price analysis
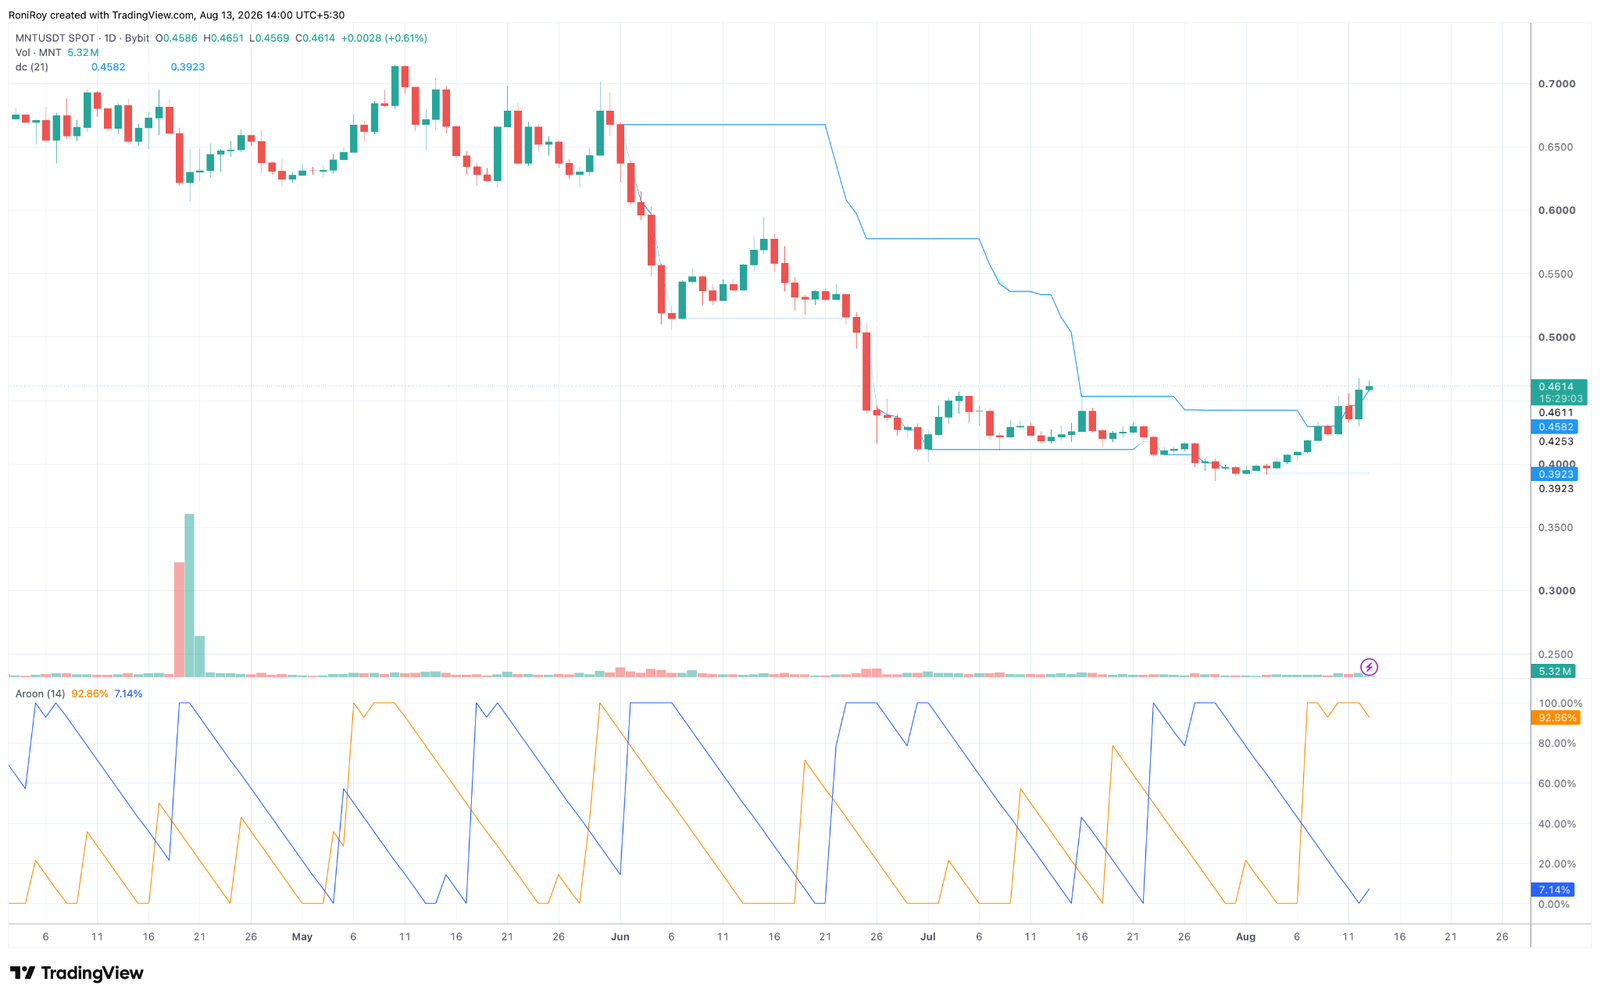
The daily $MNT/$USDT chart shows the token attempting to reverse part of the downtrend that drove its price from above $0.70 in May to below $0.40 in early August.
$MNT formed its latest base around $0.39 before beginning a series of higher daily closes.
The recovery has since carried price through the $0.42 and $0.44 areas and toward $0.46, putting the token at its highest level since late June.
See below:
$MNT/$USDT 1-day price chart. Source: TradingView.
Donchian Channels provide the first important signal on the daily chart.
$MNT was trading around $0.4614 at the time of publication, slightly above the upper Donchian boundary near $0.4582, while the lower boundary stood around $0.3923.
A daily close above the upper channel would confirm that price has broken above the recent trading range.
Since Donchian Channels track recent highs and lows, sustained trading above $0.458 could support an attempt to establish a new short-term price range above the previous ceiling.
The breakout still needs confirmation because $MNT has only recently moved through that boundary.
Losing $0.458 and closing back inside the channel would weaken the breakout and put the previous consolidation area back in play.
Momentum on the daily chart is also considerably more stretched.
The Aroon indicator showed Aroon Up near 92.86%, while Aroon Down was only about 7.14%.
The large gap shows that $MNT recently recorded a new high within the indicator’s lookback period while its most recent low sits much further back.
As long as Aroon Up remains elevated and Aroon Down stays depressed, the indicator supports continuation of the developing uptrend.
A sharp decline in Aroon Up, particularly if accompanied by a rising Aroon Down reading, would show that the current advance is losing its trend advantage.
Price structure leaves $0.47 as the first area to clear. $MNT has already tested the region during the August 13 rally, making a sustained move above it important for another leg higher.
Beyond $0.47, the daily chart leaves relatively little recent price structure until the psychological $0.50 level.
The June selloff also makes the $0.50 to $0.52 region relevant because $MNT traded around that area before its late June breakdown.
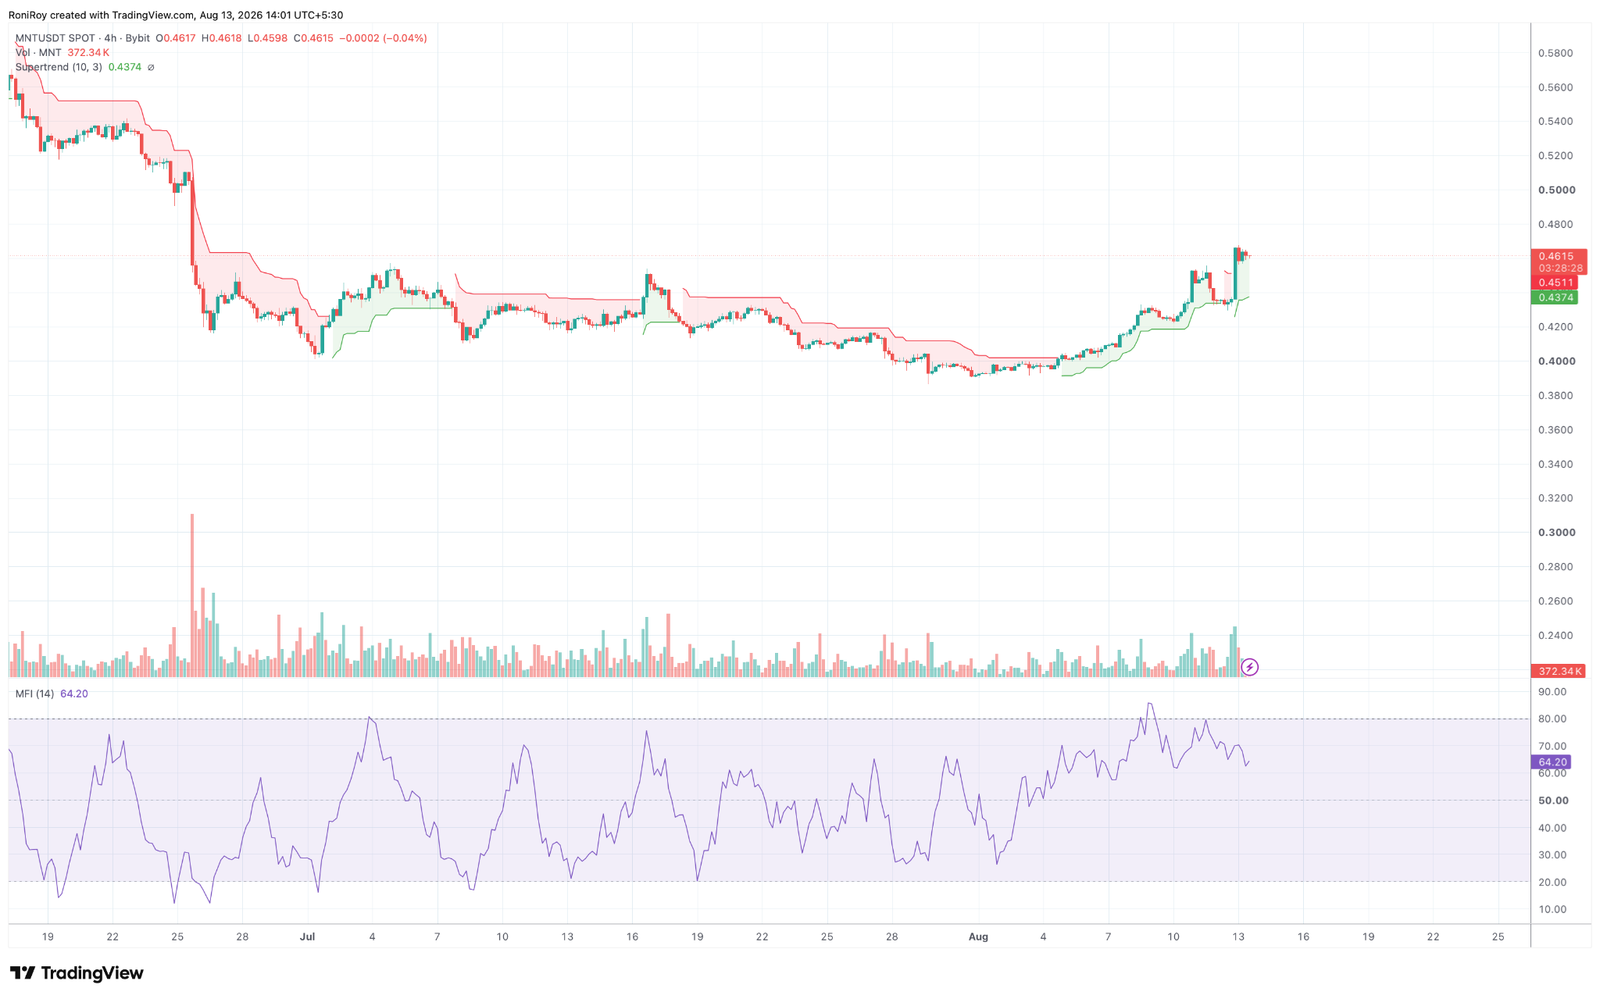
The 4-hour chart provides additional evidence that buyers have taken control of the short-term structure, although momentum has cooled from its strongest readings.
$MNT/$USDT 4-hour price chart. Source: TradingView.
$MNT was trading around $0.4615 on the 4-hour chart, while the Supertrend indicator had flipped bullish and stood near $0.4374.
Price therefore remained comfortably above the active Supertrend support after breaking out from the early August base.
The indicator had previously remained bearish through much of the decline from June into early August.
Its move below price occurred as $MNT began building higher lows and pushing through the $0.42 area.
Holding above the Supertrend level around $0.437 would preserve that bullish 4-hour setup.
A pullback toward the area could therefore become an important test if traders take profits after the latest surge.
The Money Flow Index was at 64.20 on the same chart. MFI incorporates both price and volume, and its current reading shows buying pressure remains relatively strong without sitting in the conventional overbought region above 80.
Earlier in the rally, MFI briefly moved above 80 before retreating as $MNT continued trading near its local highs.
The decline toward 64 while price remains above $0.46 means the indicator has moved away from an overheated reading without yet dropping below the midpoint.
For continuation, $MNT would first need to turn the $0.46 area into support and clear the recent high around $0.465 to $0.47.
A confirmed break above that zone would put $0.50 in focus, followed by the former June trading region around $0.52.
On the downside, a rejection from $0.47 would leave the 4-hour Supertrend around $0.437 as an important dynamic support level.
Below it, the recent breakout area around $0.42 to $0.43 becomes the next price zone visible on both the daily and 4-hour structures.
The lower daily Donchian boundary near $0.392 remains the larger invalidation area for the recovery structure, close to the early August lows from which the current rally began.