Finbold’s AI-powered forecasting model has projected that $XRP could see further downside by the end of August, pushing the asset close to losing the key $1 support level.
According to the Finbold AI Agent, $XRP could trade at an average price of $1.01 on August 31, 2026, implying a decline of about 4.47% from its current price of $1.06.
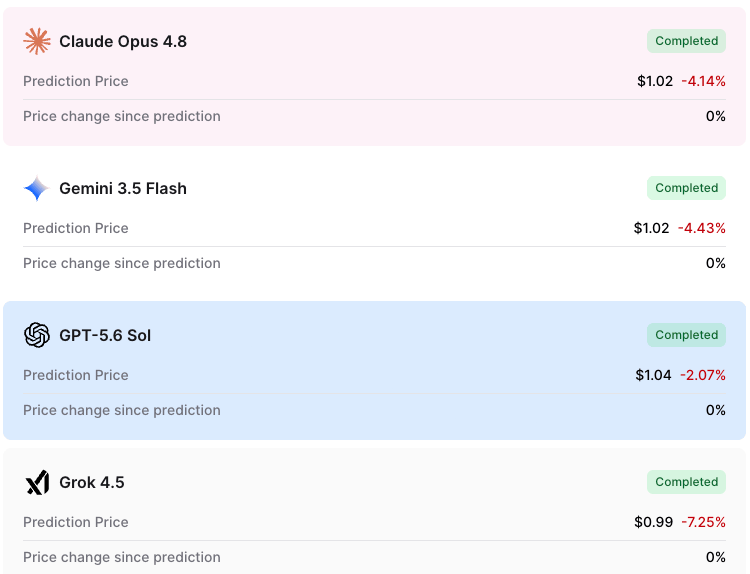
The latest $XRP price prediction was generated using multiple large language models, including Claude Opus 4.8, Gemini 3.5 Flash, GPT-5.6 Sol, and Grok 4.5. The forecast also incorporated technical indicators such as the MACD, RSI, Stochastic Oscillator, 50-day SMA, and 200-day SMA.
The average target across the four models stands at $1.01, suggesting $XRP may remain largely range-bound through the end of August.
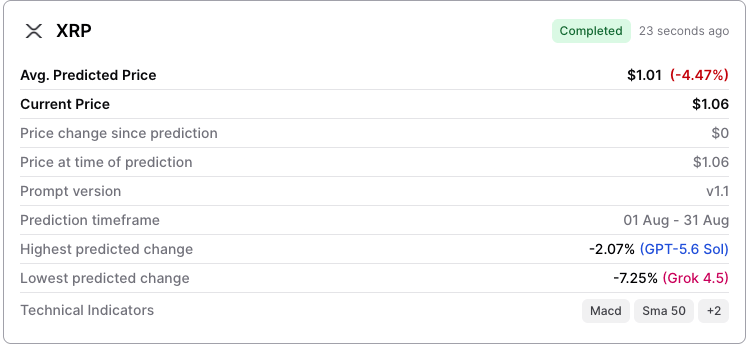
Among the individual forecasts, GPT-5.6 Sol delivered the most optimistic outlook with a target of $1.04, representing a potential decline of about 2.07% from current levels. Claude Opus 4.8 and Gemini 3.5 Flash both projected $XRP at $1.02, while Grok 4.5 issued the most bearish forecast at $0.99, implying a possible drop of 7.25%.
The prediction comes as $XRP continues to trade near the lower end of its recent range following a prolonged downtrend.
$XRP’s weakening technicals
At the same time, technical indicators incorporated into the forecast currently show mixed signals. The MACD has flattened in recent weeks, indicating weakening momentum, while the Stochastic Oscillator remains in neutral territory after recovering from oversold conditions earlier in the summer.
With trend-following and momentum indicators showing limited conviction, the machine learning model suggests $XRP could continue consolidating around the $1 level over the coming month.
While the outlook does not point to a major breakdown, it also indicates limited upside unless $XRP regains stronger bullish momentum and moves decisively above key resistance levels.
In the absence of $XRP-specific catalysts, the asset is likely to remain heavily influenced by broader cryptocurrency market trends.
$XRP price analysis
By press time, $XRP was trading at $1.06, down about 0.8% over the past 24 hours and more than 2% on the weekly timeframe.
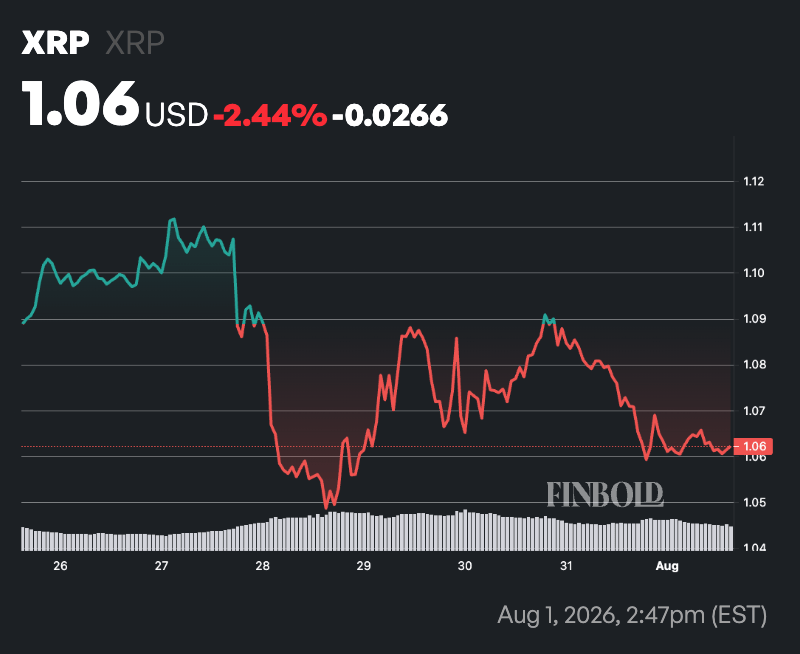
From a technical perspective, $XRP remains under pressure, trading below both its 50-day SMA of $1.11 and 200-day SMA of $1.36. This suggests the cryptocurrency is still in a bearish medium- and long-term trend, with buyers yet to regain control.
Meanwhile, the 14-day RSI stands at 41.36, a neutral reading that shows momentum has improved from oversold levels but remains slightly tilted toward sellers.