
As of September 18, 2026, LINKUSDT trades at $11.83 amid conflicting signals across timeframes. The LINKUSDT technical analysis: bullish structure holds, but momentum is losing its grip — a dynamic that demands patience over impulsive positioning in the sessions ahead.
Key takeaways
- LINKUSDT trades at $11.83 with the daily EMA stack (20/50/200) in full bullish alignment, confirming an intact medium-term uptrend.
- Daily RSI14 at 55.98 shows no exhaustion, but the MACD histogram has turned negative at -0.14, signaling decelerating momentum.
- H1 RSI14 at 77.1 flashes an overbought warning, with price hugging the upper Bollinger Band at 11.86.
- Total crypto market cap at $2.68 trillion and a Fear & Greed Index of 56 reflect cautious but not bearish sentiment.
- Tight pivot ranges on both H1 and M15 timeframes suggest the market is coiling for a decisive move.
Daily Trend: Structure Still Up, But Momentum Cracks
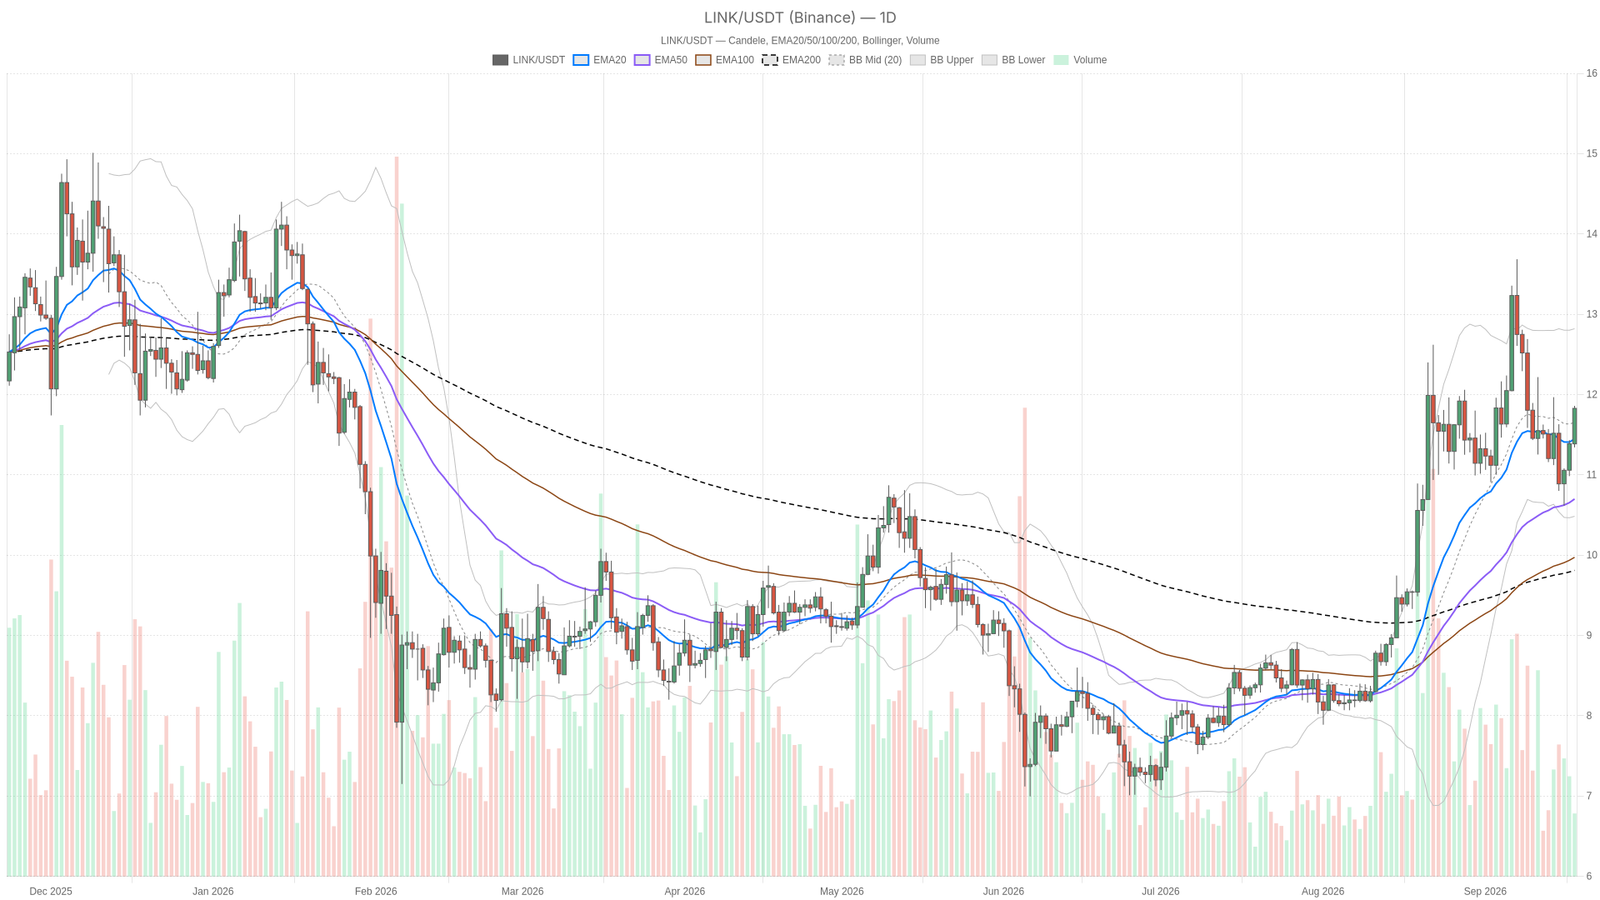
The daily regime is classified as bullish, backed by a clean EMA stack: price at $11.83 sits above the EMA20 (11.45), which sits above the EMA50 (10.7), which in turn sits above the EMA200 (9.81). That staircase structure confirms the medium-term bias remains firmly upward.
The LINKUSDT technical analysis: bullish structure holds, but momentum is losing its grip — a message reinforced by the daily MACD. The MACD line at 0.19 sits below the signal line at 0.33, producing a negative histogram of -0.14. In plain terms, momentum has been decelerating even while the trend structure stays intact. That divergence is not a sell signal on its own, but it is a caution flag worth tracking closely.
RSI14 on the daily reads 55.98, a comfortable level that signals no exhaustion yet at this timeframe. Bollinger Bands show the mid-band at 11.65, upper at 12.82, and lower at 10.48. With price at 11.83 sitting just above the midline, there is room to move in either direction before hitting either extreme. The ATR14 reading of 0.7 defines the daily volatility envelope, while pivot data places price in the upper half of the range: pivot at 11.68, resistance R1 at 12.01, and support S1 at 11.49.
Hourly and 15-Minute View: Overbought Signals Flash Caution
On the H1 timeframe, price at 11.82 remains above the EMA20 (11.51), EMA50 (11.32), and EMA200 (11.45). That is another bullish alignment, though the chart is labeled neutral, signaling more fragility than the daily would suggest.
The standout number is the H1 RSI14 at 77.1, firmly in overbought territory. Combined with a MACD histogram barely positive at 0.03, short-term momentum looks stretched and close to running out of fuel. Bollinger Bands reinforce this concern: price at 11.82 hugs the upper band at 11.86, with the midline at 11.48 sitting well below current levels. Pivot data adds further tension — pivot at 11.82, R1 at just 11.86, and S1 at 11.79 — forming an unusually tight range where price is essentially glued to its pivot point.
The 15-minute chart mirrors this picture. Price at 11.83 stays above all three EMAs, but RSI14 at 69.44 approaches overbought territory, and the MACD histogram has essentially flattened to zero. The M15 pivot range (pivot 11.83, R1 11.86, S1 11.8) confirms the same compression seen on the hourly chart. This market is coiled rather than trending cleanly at the moment.
The Bullish Case
If LINKUSDT holds above the daily EMA20 near 11.45 and defends the pivot cluster around 11.68–11.79, the path of least resistance remains up. A push through H1/M15 resistance at 11.86 with the MACD histogram turning positive on lower timeframes would signal momentum resetting rather than reversing.
That outcome would open the door toward the daily R1 at 12.01 and eventually the upper Bollinger Band near 12.82. This scenario requires the overbought hourly RSI to cool through consolidation rather than a sharp selloff. A sideways digestion phase would actually strengthen the bullish case by relieving the short-term overextension.
The Bearish Case
The risk case centers on the daily MACD histogram deepening further into negative territory. If price loses the daily pivot at 11.68 and breaks below S1 at 11.49, the momentum warning would be confirmed as more than just noise.
A sharp unwind of the H1 RSI from 77 down through the 50 zone, especially if it happens rapidly, would suggest accelerating profit-taking. The clearest invalidation of bullish structure would be a daily close below the EMA20 at 11.45 or a break under the EMA50 at 11.32 on the hourly chart. Both scenarios would open room toward the daily EMA50 at 10.7.
Broader Market Backdrop
Context matters here. Total crypto market capitalization sits at roughly $2.68 trillion, down 0.65% over 24 hours according to CoinGecko, while Bitcoin dominance holds at 58.05%. That is not a market in panic, but it is also not aggressively rotating into altcoins — a mixed signal that aligns with the Fear & Greed Index reading of 56.
On the DeFi side, DefiLlama data shows Uniswap V3 and V4 fees down double digits over 24 hours (-21.12% and -16.6% respectively) but up over 100% on a 30-day basis. Meanwhile, Curve DEX fees are up 14.37% over seven days. This points to on-chain activity that has been robust over the past month even as daily flows cool off — a backdrop of underlying resilience relevant given $LINK’s role as infrastructure within the broader DeFi and oracle ecosystem.
FAQ
What is the current LINKUSDT price and overall trend?
As of September 18, 2026, LINKUSDT trades at $11.83. The daily chart shows a bullish trend with price above all major EMAs (20, 50, and 200), though the MACD histogram at -0.14 indicates momentum is decelerating beneath the surface.
Is LINKUSDT overbought on shorter timeframes?
Yes. The H1 RSI14 reads 77.1, firmly in overbought territory, and price is hugging the upper Bollinger Band at 11.86. The 15-minute RSI14 at 69.44 is also approaching overbought levels, suggesting short-term caution is warranted.
What are the critical support and resistance levels to watch?
Key resistance sits at 11.86 (H1/M15 level) and 12.01 (daily R1). Critical support includes the daily pivot at 11.68, S1 at 11.49, and the daily EMA20 at 11.45. A break below the EMA20 would invalidate the near-term bullish structure.
How does the broader crypto market affect LINKUSDT’s outlook?
Total crypto market cap at $2.68 trillion and Bitcoin dominance at 58.05% suggest a cautious environment, not panic. The Fear & Greed Index at 56 reflects moderate greed, while strong 30-day DeFi activity provides underlying support for oracle-linked assets like $LINK.
Disclaimer: This article is for informational purposes only and does not constitute financial advice, an investment recommendation, or a solicitation to buy or sell any financial instrument or cryptocurrency. The analysis provided is not indicative of future results. Investing in crypto assets and financial markets carries a high risk of capital loss. Always do your own research (DYOR) and consult a qualified financial advisor before making any decision.
Article produced with the assistance of artificial intelligence and reviewed by the editorial team.