
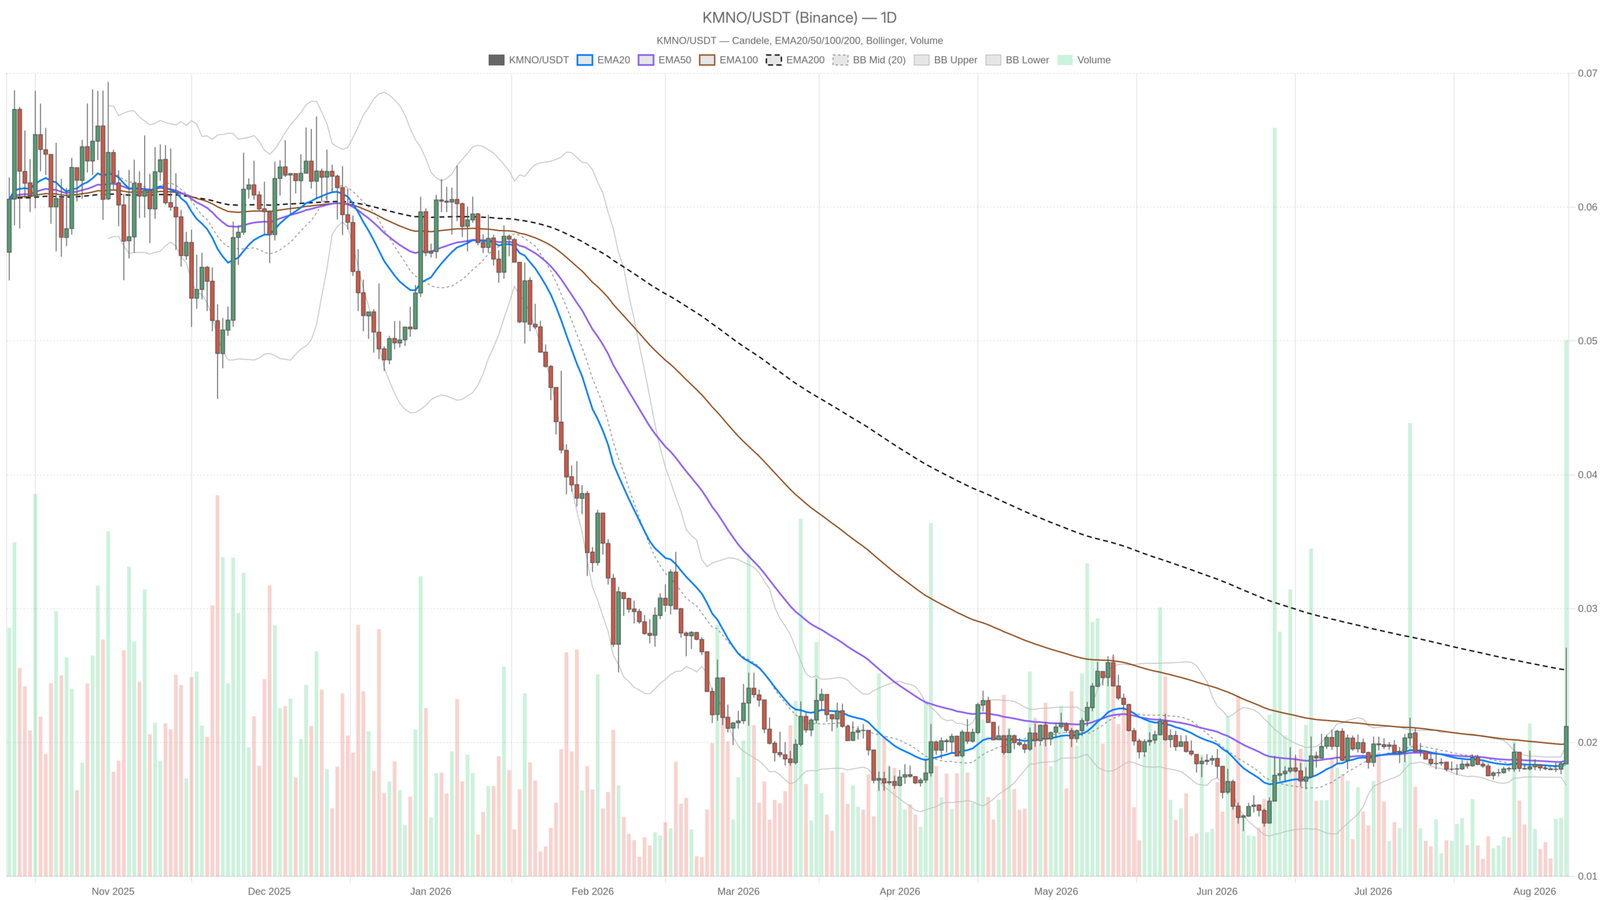
As of August 7, 2026, a tense technical standoff defines the outlook for Kamino crypto. Short-term momentum appears euphoric, yet the daily structure remains damaged, with price pinned below the 200-day EMA that separates relief rallies from genuine trend reversals.
Key takeaways
- $KMNO/$USDT trades near $0.02, while the 200-day EMA sits roughly at $0.03 above current price
- Daily RSI at 69.88 and hourly RSI at 84.04 signal overbought conditions across multiple timeframes
- Bitcoin dominance at 56.63% and the Fear & Greed Index at 29 reflect a broader risk-off environment
- Bollinger Bands are compressed across all timeframes, indicating a coiled market ready for expansion
- A daily close above the $0.03 200-EMA confluence would provide the first genuine evidence of trend reversal
The daily chart shows mean reversion, not a new trend
The daily chart is reverting to the mean rather than building a new trend. Close, 20-EMA and 50-EMA all cluster at the $0.02 area — the technical signature of a market that has stopped falling but has not started climbing. The system classifies the daily regime as neutral, and that label is honest.
Flat, overlapping moving averages remove directional edge by turning the chart into a range. In this environment, the profitable behaviour is fading extremes rather than buying breakouts. Moreover, the 200-day EMA above price keeps the bearish structural bias alive. Until Kamino closes daily candles above that $0.03 zone, every advance remains a rally inside a broader downtrend. Such rallies can be violent and profitable — they are simply not durable by default.
Overbought momentum signals exhaustion risk
Momentum has moved into overbought territory without producing structural progress, which typically signals an exhausted bounce rather than a sustainable advance. The daily RSI at 69.88 knocks on the door of overbought. Strong markets can live in the 60–70 band for weeks, but combined with a neutral price structure, this reading suggests fatigue more than acceleration.
However, the 1-hour chart presents an even more uncomfortable picture. RSI at 84.04 is deeply overbought, and the hourly regime is flagged as bullish with price above all three hourly EMAs. Short-term buyers are in full control, but they are paying up. Readings north of 80 rarely mark the end of a move — they usually mark the middle of one, followed by consolidation that shakes out late entries.
The 15-minute frame offers a calmer picture: RSI at 68.41, bullish regime, and price holding the fast averages. For trade execution, the tell is whether pullbacks hold the 20-EMA. If they do, the squeeze has legs into the daily R1. If the 15m loses its fast averages and starts printing lower highs, the hourly overbought condition begins unwinding fast.
MACD offers no useful signal here. Line, signal and histogram all print at zero across daily, hourly and 15-minute frames due to the low nominal price. The same issue affects ATR14, reported as zero on all three timeframes.
Volatility must therefore be judged from price behaviour and the compressed Bollinger Bands rather than from clean indicator readings. Bands that tight describe a coiled market — stored energy that warns against assuming the current range will hold indefinitely.
Two scenarios will determine the next move
The path forward hinges on whether $KMNO can hold the $0.02 pivot as support and challenge the 200-day EMA, or whether momentum simply exhausts and price reverts lower. Both scenarios are equally valid given the conflicting signals across timeframes.
The bullish path requires holding the $0.02 pivot area as support and using the hourly overbought condition as a base rather than a top. Price would then push into the daily R1 at $0.03, which coincides with the 200-day EMA. A decisive daily close above that confluence would flip the macro bias from neutral to constructive — the first genuine evidence that the downtrend has broken.
However, this bullish thesis collapses if the $0.02 daily pivot is lost on rising volume, or if hourly RSI collapses from 84 back through the midline while price slips under its clustered hourly EMAs. That combination would confirm the move was a squeeze, not accumulation.
The bearish path, by contrast, needs almost nothing to go right. Daily RSI already sits near 70 and hourly RSI at 84 — momentum simply has to stop expanding. Price rejects the $0.03 200-EMA, the daily S1 at $0.02 comes into play, and the flat 20/50 EMAs offer no cushion because they sit exactly where price already is. Falling market-wide volume makes this the path of least resistance.
Conversely, the bearish outlook fails if a daily close above the 200-EMA occurs with follow-through, or if the macro tone shifts. Bitcoin dominance rolling over from 56.63% and the Fear & Greed Index lifting out of its 29 reading would meaningfully improve odds for altcoin beta.
DeFi sector data supports selective, not broad, strength
The on-chain fee data from DeFi protocols shows capital rotating between venues while maintaining a positive monthly trend — a backdrop that helps individual tokens but does not lift the entire sector. Kamino benefits from this selective environment, but broad sector-wide conviction remains absent.
Uniswap V3 fees fell 12.99% on the day and 13.56% over the week, yet remain up 38.7% over 30 days. Curve DEX shows the same shape — down 9.24% daily and 12.46% weekly, but up 25.96% on the month. This pattern of short-term weakness overlaying monthly strength defines the current DeFi landscape.
Meanwhile, Fluid DEX is up 68.71% over seven days and Ekubo has surged 112.33% in a single day and 78.78% on the week. Uniswap V4 fees rose 32.32% on the day. Capital is rotating, not exiting — a nuance that supports selective strength without signalling a broad DeFi revival.
Patience is the most defensible positioning strategy
The current setup rewards waiting for confirmation at key levels rather than chasing intraday momentum that is already extended. The honest read on Kamino crypto here is that this is a low-conviction environment dressed up as a strong one.
The hourly chart looks compelling precisely because the move is already stretched, while the daily chart looks unimpressive because nothing structural has changed. These two facts are not in conflict — they describe a market where the reward for chasing is small and the cost of being wrong is amplified by compressed volatility conditions.
Practically, that argues for patience over participation. The two levels that matter are the $0.02 pivot below and the $0.03 confluence of R1 and the 200-day EMA above. Everything in between is noise generated by a two-cent price grid where indicator readings lose resolution.
Add a macro tape showing Fear at 29, shrinking volume and Bitcoin absorbing over 56% of total market capitalization, and the risk of a fast unwind is real. The market will tell you which scenario it has chosen at those two levels — and until it does, the only defensible stance is smaller size and wider tolerance for volatility.
FAQ
What is the key resistance level for $KMNO right now?
The critical resistance sits at $0.03, where the daily R1 pivot coincides with the 200-day EMA. A decisive daily close above this level would provide the first genuine evidence that the downtrend has broken.
Why are MACD and ATR readings showing zero across all timeframes?
The low nominal price — roughly $0.02 — compresses indicator values below meaningful resolution. This is a granularity issue, not a trading signal. Volatility must be assessed through price behaviour and Bollinger Band structure instead.
Is the current rally sustainable given broader market conditions?
Sustainability faces significant headwinds. Bitcoin dominance at 56.63%, the Fear & Greed Index at 29, and declining aggregate trading volume all suggest risk appetite remains limited. Without a structural improvement in these macro indicators, rallies within the downtrend tend to fade.
What would invalidate the bullish case?
A loss of the $0.02 daily pivot on rising volume, or an hourly RSI collapse from 84 back through the midline while price slips under its clustered hourly EMAs, would confirm the move was a squeeze rather than genuine accumulation.
Disclaimer: This article is for informational purposes only and does not constitute financial advice, an investment recommendation, or a solicitation to buy or sell any financial instrument or cryptocurrency. The analysis provided is not indicative of future results. Investing in crypto assets and financial markets carries a high risk of capital loss. Always do your own research (DYOR) and consult a qualified financial advisor before making any decision.
Article produced with the assistance of artificial intelligence and reviewed by the editorial team.