
Ripple's native token $XRP has dropped below the $1.10 support level after pausing its recent rally, with traders weighing improving macroeconomic conditions against weak institutional demand.
Although easing US inflation has boosted risk sentiment across financial markets, $XRP continues to face resistance as retail participation remains modest and spot exchange-traded fund (ETF) inflows slow.
Cooling US inflation supports risk assets
Investor sentiment improved after the US Bureau of Labor Statistics (BLS) reported that the Consumer Price Index (CPI) fell 0.4% month-over-month in June on a seasonally adjusted basis, marking the largest monthly decline since April 2020.
Lower inflation has strengthened expectations that financial conditions could become more supportive for risk assets, including cryptocurrencies.
However, confidence across the crypto market remains cautious.
The Crypto Fear & Greed Index rose only slightly to 30 from 24, remaining firmly in Extreme Fear territory.
The reading suggests investors are becoming less pessimistic but have yet to embrace a broad risk-on environment.
Derivatives data points to a decline in retail activity. According to CoinGlass, $XRP perpetual futures Open Interest (OI) is down by 2.3% in the last 24 hours and now reads $2.4 billion.
The Open Interest remains below the June peak of $2.7 billion, indicating that speculative demand has yet to fully recover.
Institutional interest appears even softer. Data from the CoinGlass ETF page shows $XRP spot ETFs have recorded limited trading activity throughout the week, with $6.8 million in inflows recorded on Thursday.
However, the cumulative net inflows remain at $1.5 billion and total net assets stand at approximately $1 billion.
The muted ETF activity suggests institutional investors are taking a cautious approach despite improving macroeconomic conditions.
Ripple price forecast: $XRP to defend the $1.0 critical support
The $XRP/USD 4-hour chart remains bearish as Ripple is under pressure after dropping below the important $1.10 support area.
The token continues to trade below the 50-day Exponential Moving Average (EMA) at $1.16, the 100-day EMA ($1.25), and the 200-day EMA ($1.46)
These levels represent significant resistance and continue to reinforce the broader bearish trend.
Meanwhile, $XRP has dropped below $1.10, indicating that buyers failed to defend the area as the broader crypto market continues to underperform.
Technical indicators paint a mixed picture. The Relative Strength Index (RSI) is hovering around 52, reflecting neutral momentum with neither buyers nor sellers firmly in control.
Meanwhile, the Moving Average Convergence Divergence (MACD) has turned slightly positive, hinting at an early recovery attempt.
However, the signal remains relatively weak and has yet to confirm a sustained bullish reversal.
If $XRP manages to rebound, the first resistance zone lies between the 50-day EMA at $1.16. A decisive move above this area could open the door for a test of the 100-day EMA at $1.25,
However, the 200-day EMA at $1.46 remains the major long-term resistance. Beyond that, a descending trendline near $1.55 represents another significant barrier for bulls.
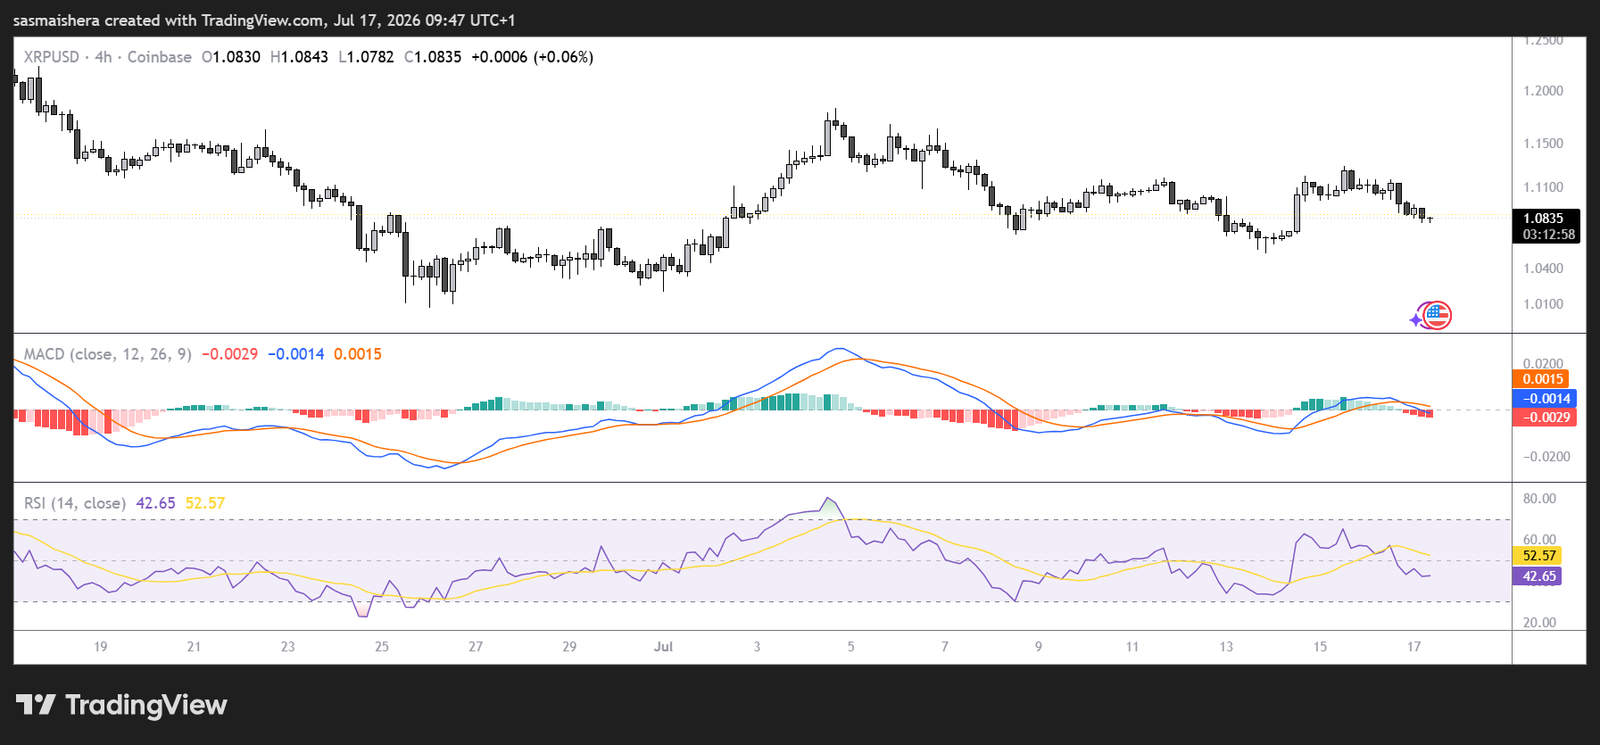
On the downside, $1.10 remains the most important support level.
A breakdown below this zone could accelerate selling pressure toward the lower support near $1.03, which may serve as the next key demand area.
For now, $XRP's near-term direction will likely depend on whether improving macroeconomic sentiment can translate into stronger retail participation and renewed institutional inflows.