
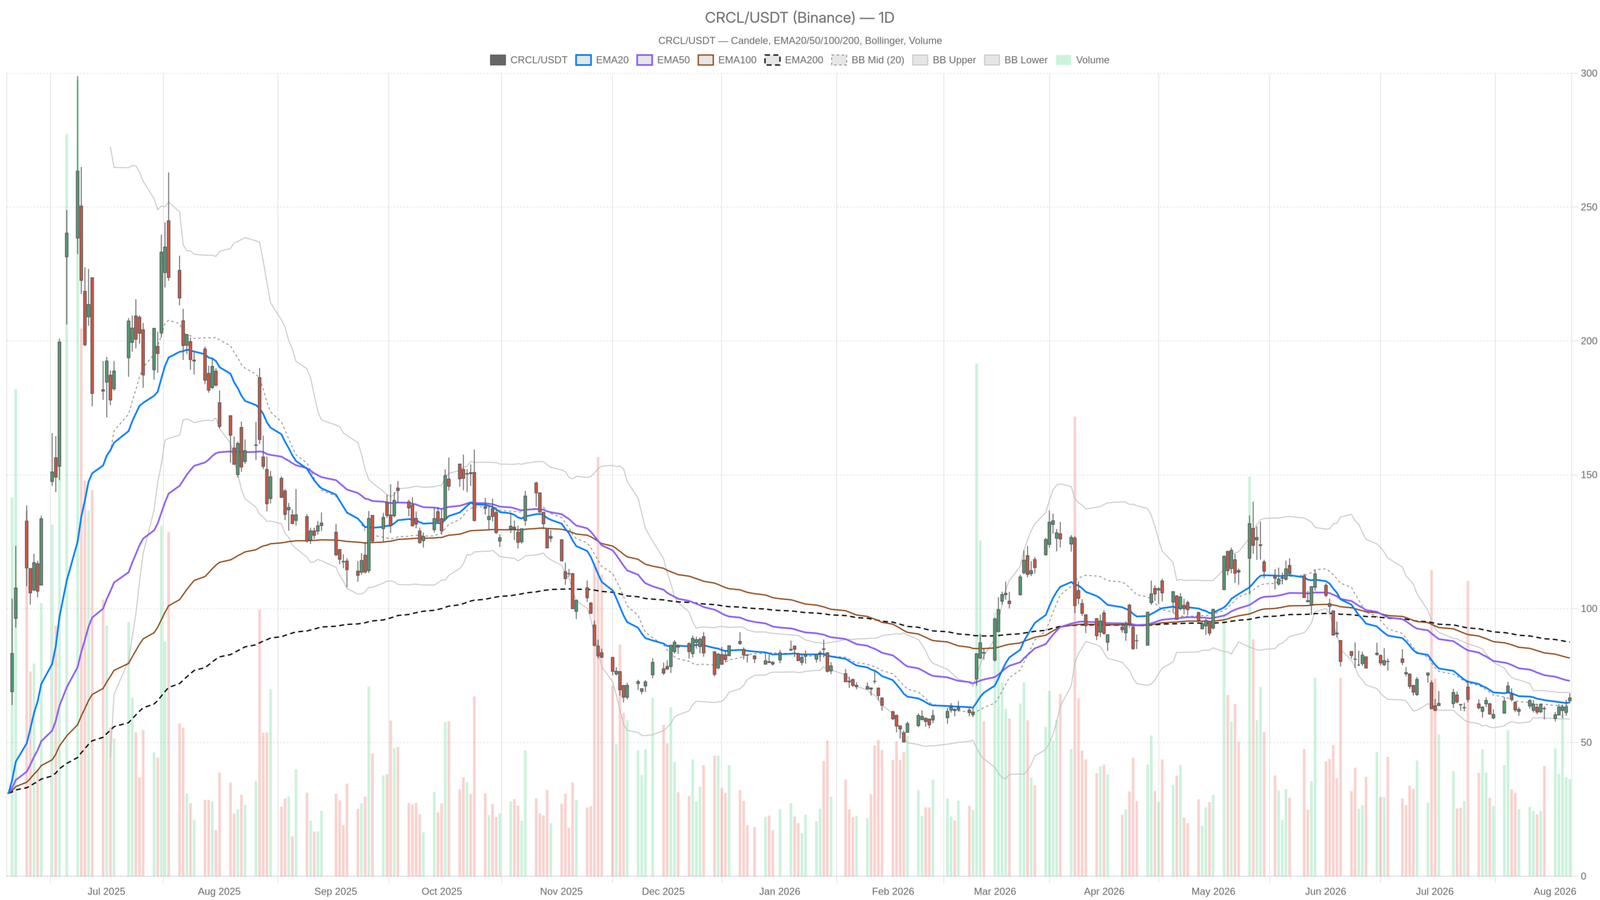
Circle Stock is caught between conflicting realities: a broken daily structure and a stabilising short-term tape. CRCL closed at $66.67 after testing $68.40, with sellers still defending the upper edge of the recovery. Until that changes, the rally remains corrective.
Key takeaways
- CRCL trades roughly 24% below its 200-day moving average, confirming a bearish daily structure.
- Resistance is clustered in the $68.40–$68.74 zone, reinforced by the upper Bollinger Band and the daily R1 pivot.
- Support sits at $64.83–$64.95, where the 20-day EMA and daily S1 pivot converge.
- Daily ATR of 4.84 represents over 7% of the share price, signalling extreme volatility.
- The hourly trend leans bullish, but the daily trend still points lower, creating a genuine structural conflict.
What the Daily Chart Says About Circle Stock
The daily chart shows Circle Stock in a clear downtrend with a short-term bounce. Price trades far below its long-term averages and faces a well-defined ceiling near $68.50.
Trend Structure and Resistance Levels
The moving average stack is the clearest evidence of damage. The 20-day EMA sits at $64.95, below price. However, the 50-day EMA stands at $73.03 and the 200-day at $87.53. Price is roughly 24% below its 200-day EMA. That is a downtrend with a short-term bounce inside it, nothing more.
Meanwhile, Bollinger Bands frame the tactical problem. The mid-band sits at $63.76 and the upper band at $68.74. Friday’s high of $68.40 pushed almost exactly into that upper boundary and failed. Notably, the daily R1 pivot at $68.45 sits in the same pocket. Two independent references converging in the same half-dollar zone create a genuine ceiling.
Momentum and Volatility Profile
However, momentum is more constructive. Daily RSI sits at 50.05, dead centre. MACD remains negative at -2.45. But the signal line is lower at -3.49, leaving a positive histogram of 1.03. Bearish momentum is fading rather than accelerating. This is the classic profile of a market that has stopped falling but has not yet proved it can rise.
Notably, volatility remains the dominant risk factor. Daily ATR of 4.84 is over 7% of the share price. In practical terms, a single normal session can travel the entire distance between support and resistance. Position sizing built on tight assumptions will not survive this tape.
On the downside, the daily S1 pivot at $64.83 lines up closely with the 20-day EMA at $64.95. That $64.83–$64.95 confluence is the first real test for buyers. Losing it would push attention back toward the Bollinger mid-band near $63.76.
The 1H Chart Complicates the Bearish Case
The hourly chart works against an immediate breakdown. Short-term averages are rising and correctly ordered, with price holding above key EMAs.
The 1H close at $66.69 sits above both the 20-hour EMA at $65.30 and the 50-hour EMA at $64.07. The short averages are rising and correctly ordered. Momentum agrees. Hourly RSI at 57.86 leans bullish without being stretched. MACD is positive at 1.19 versus a 1.01 signal.
However, the histogram has thinned to 0.18. Upward thrust is flattening rather than expanding. The more important detail is the 200-hour EMA at $66.07. Price is only marginally above it. This is a reclaim, not a decisive escape. It is exactly the level bulls must hold to keep the recovery credible.
The hourly pivot adds further nuance. The pivot point sits at $66.99, above the last close, with R1 at $67.33 and S1 at $66.34. In other words, the tape ended below its own reference level. Sellers had the final word in the closing hours, even inside a bullish short-term structure. The hourly upper band at $68.51 reinforces the same overhead zone flagged on the daily chart.
15m Execution Context
The 15-minute chart shows a cooling impulse within an intact short-term uptrend. Price is consolidating in a narrow range with muted intraday movement.
On the 15-minute chart, the immediate impulse has cooled. Price at $66.69 is below the 20-period EMA at $66.77 and below the Bollinger mid-band at $66.91. MACD has crossed negative, with the histogram at -0.07. Bands have compressed into a narrow $66.25–$67.57 corridor. ATR of 0.59 confirms muted intraday movement.
Meanwhile, the deeper 15m averages remain supportive, with the 50-period at $65.84 and the 200-period at $63.76. Therefore, the shortest timeframe reads as consolidation inside an intact short-term uptrend. It is a pause, not a reversal signal on its own.
Bullish Scenario
The bullish scenario requires a daily close above the $68.40–$68.74 resistance zone. Confirmation would come from re-expanding hourly MACD momentum and price holding above the 200-hour EMA on any retest.
The constructive case needs acceptance above the $68.40–$68.74 band. A daily close is required, not just an intraday spike. Confirmation would come from the hourly MACD histogram re-expanding. Price must also hold above the 200-hour EMA at $66.07 on any retest. In that outcome, the daily MACD improvement matures into a real momentum shift. The 50-day EMA at $73.03 then becomes the next logical magnet.
Fundamentally, the bullish narrative leans on scale. Circle reported USDC onchain transaction volume of $14.8 trillion in Q2 2026, up 151%. CEO Jeremy Allaire has framed the company as infrastructure for an “internet financial system.” This is a broader vision than a single-product stablecoin business.
Bearish Scenario
The bearish case is the path of least resistance given the dominant daily structure. A rejection at the upper band followed by a loss of the $64.83–$64.95 support zone would invalidate the recovery.
The bearish path is simpler. The dominant structure already favours it. A rejection at the upper band followed by a loss of $64.83–$64.95 would invalidate the recovery. Below that, the $63.76 mid-band becomes the reference. The broader downtrend defined by the 50- and 200-day EMAs then reasserts itself.
On the fundamental side, the tone has cooled. One fair value estimate was cut from $133.71 to $107.98. Q2 came in as a miss. Street targets span roughly $25 to $157. This extreme dispersion helps explain the elevated ATR.
Positioning Takeaways for Circle Stock
Circle Stock sits in a defined range with clear boundaries and unusually wide daily swings. Until one boundary breaks on a closing basis, conviction should stay low.
Overall, Circle Stock sits in a defined range with clear boundaries. Resistance is stacked at $68.40–$68.74 and support is layered at $64.83–$64.95, then $63.76. The daily trend still points lower, while the hourly trend points higher. That conflict is genuine rather than cosmetic.
Therefore, until one of those boundaries breaks on a closing basis, conviction should stay low. Volatility is high, analyst opinion is deeply split, and the technical picture is mixed by definition. Range extremes carry the information here. The middle carries mostly noise.
FAQ
What is the key resistance level for Circle Stock?
Circle Stock faces key resistance in the $68.40–$68.74 zone. This band is reinforced by both the daily upper Bollinger Band at $68.74 and the daily R1 pivot at $68.45. A daily close above this zone is needed to confirm a breakout.
Is CRCL in a downtrend?
Yes, the daily structure remains bearish. CRCL trades roughly 24% below its 200-day EMA at $87.53. The 50-day EMA at $73.03 also sits well above the current price. The ongoing rally is considered corrective within a broader downtrend.
What are analysts expecting for Circle Stock?
Analyst targets for CRCL span an unusually wide range from approximately $25 to $157. One fair value estimate was recently cut from $133.71 to $107.98. This extreme dispersion reflects deep uncertainty about the stock’s valuation.
How volatile is Circle Stock right now?
Circle Stock is extremely volatile. Its daily ATR of 4.84 represents over 7% of the share price. This means a single normal session can travel the entire distance between support and resistance, making tight position sizing essential.
Disclaimer: This article is for informational purposes only and does not constitute financial advice, an investment recommendation, or a solicitation to buy or sell any financial instrument or cryptocurrency. The analysis provided is not indicative of future results. Investing in crypto assets and financial markets carries a high risk of capital loss. Always do your own research (DYOR) and consult a qualified financial advisor before making any decision.
Article produced with the assistance of artificial intelligence and reviewed by the editorial team.