
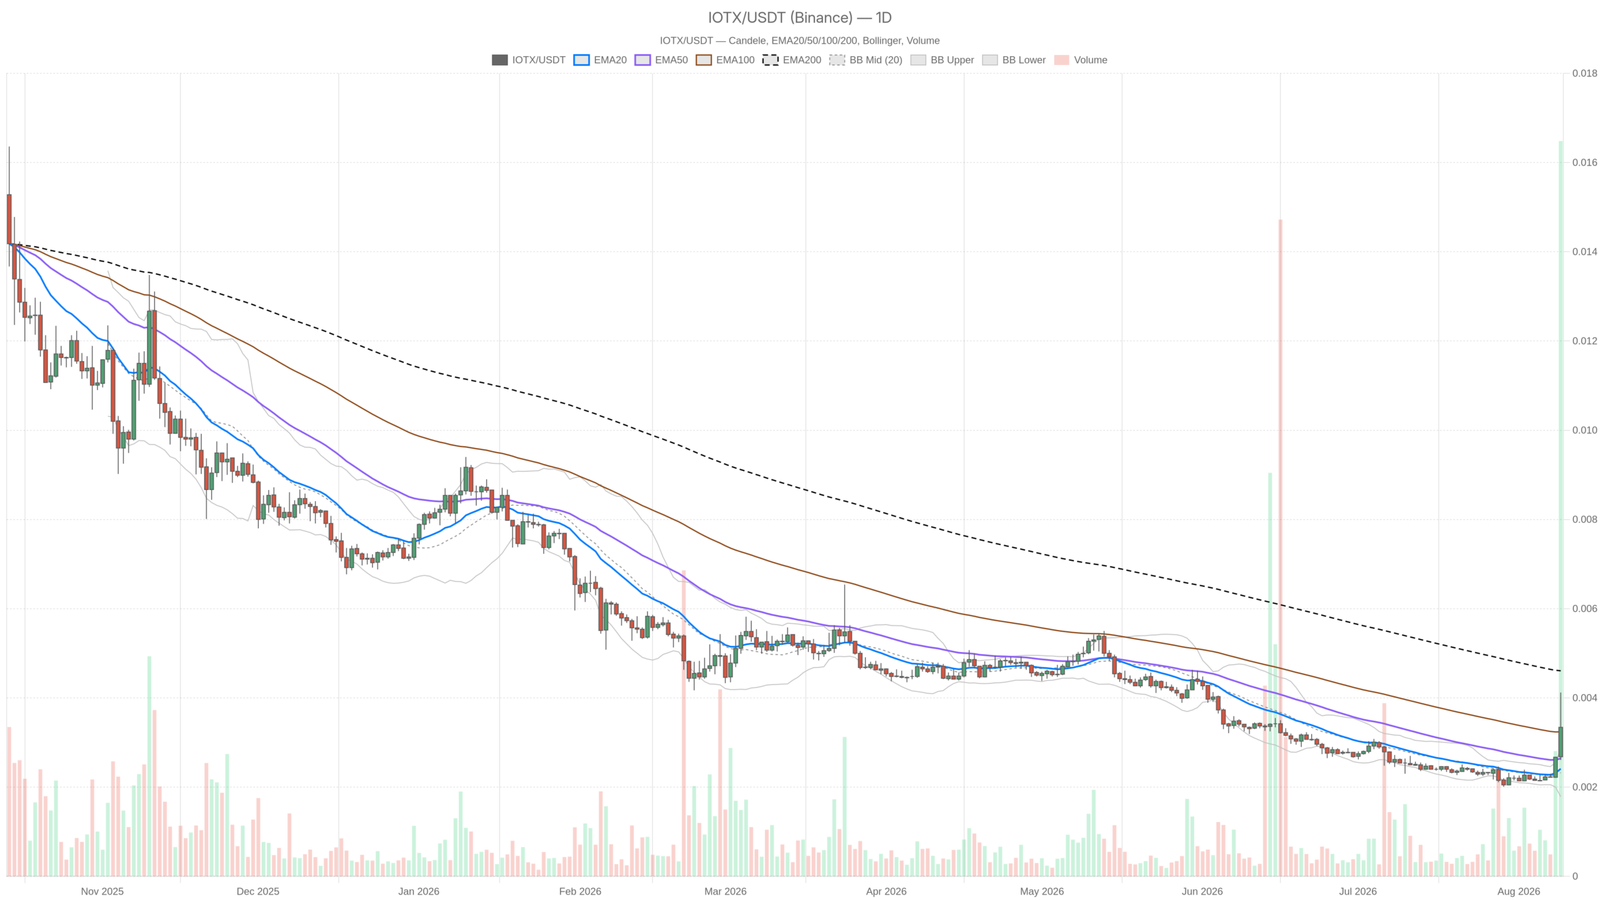
On August 9, 2026, traders are watching IoTeX crypto sit in an uncomfortable spot: daily momentum runs hot while the broader market refuses to cooperate. The RSI prints 75.77 deep in overbought territory, yet the daily regime remains neutral and the Fear & Greed Index reads 31.
Key takeaways
- Daily RSI at 75.77 signals overbought conditions inside a neutral daily regime, creating tension between momentum and structure.
- The Fear & Greed Index stands at 31, with total crypto market capitalization around $2.29 trillion and 24-hour volume down over 40%.
- Bitcoin dominance at 56.61% shows capital remains concentrated in majors, leaving mid-cap altcoins moving on isolated flow.
- Hourly chart holds a bullish regime with RSI at 64.8, offering constructive intraday bias not yet exhausted.
- DeFi fee generation is contracting sharply across major venues, weakening the participation base an altcoin rally needs to sustain itself.
Why does this matter now? The money is not rotating. Total crypto market capitalization sits at roughly $2.29 trillion, essentially flat on the day, while 24-hour volume has collapsed by more than 40%. Bitcoin dominance holds at 56.61%. In plain terms: liquidity is thin, capital is defensive, and the majors are absorbing whatever risk appetite exists. A mid-cap altcoin pushing an overbought daily RSI in that environment is not being lifted by a rising tide. It is moving on isolated flow, and those moves can extend violently but unwind faster than trend-driven advances.
The dominant force: momentum without structural confirmation
The chart reveals two competing mechanics: aggressive momentum on the daily timeframe and the gravitational pull of mean reversion that an RSI near 76 typically invites. The first is visible, strong, and concentrated on the higher timeframe. The second is exactly what tends to follow when the underlying regime has not flipped to trending.
Trending markets earn the right to stay overbought. Range markets do not — they punish it. That is the single most important distinction for anyone positioning right now. Until the daily regime shifts out of neutral into confirmed bullish, every extension into the upper end of the daily range should be treated as a stretched condition rather than a breakout to lean on.
Multi-timeframe read: agreement on direction, disagreement on conviction
The hourly chart is where the current bias actually lives. The H1 regime is bullish and its RSI reads 64.8 — strong, constructive, but crucially not overbought. That is a healthier print than the daily. It says buyers have controlled the intraday sequence without exhausting themselves, which is the kind of reading that can sustain continuation rather than mark a blow-off.
On the 15-minute chart, the tone changes. The regime there remains bullish, but RSI has cooled to 52.92 — dead neutral. Short-term momentum has already been spent and the market is digesting. This is not a warning sign on its own; it reflects a normal pause inside an intraday uptrend. However, it does mean the immediate tape has no directional edge and the execution window is flat.
So where is the tension? The daily says stretched and unconfirmed. The hourly says trending up with room. The 15-minute says nothing right now. That is not a clean setup — it is a hierarchy where the fastest timeframe has gone quiet while the slowest is flashing a caution light. Traders who force a position into that gap are usually paying for someone else’s exit.
What the missing pieces mean for execution
The EMA stack, MACD readings, Bollinger band envelopes, ATR, and pivot levels in this dataset do not return usable values, so they cannot confirm anything. What can be said is structural rather than numerical. The bullish regime classifications on H1 and M15 are consistent with price holding above faster moving averages on those timeframes, while the neutral daily label tells you that alignment has not propagated to the higher timeframe. Without a confirmed volatility measure, position sizing must be treated conservatively by default: when you cannot quantify the average range, you cannot quantify your stop distance, and that argues for smaller size.
The bullish case for IoTeX crypto — and what kills it
The bullish path for IoTeX crypto depends on the hourly trend staying intact while the daily regime finally graduates from neutral to confirmed bullish. The constructive sequence is straightforward: the hourly trend holds, the 15-minute consolidation resolves upward instead of rolling over, and the daily structure catches up. In that scenario, the overbought daily RSI stops being a warning and becomes a feature. Sustained readings above 70 are typical of genuine trend initiation, and a mid-cap moving independently while Bitcoin dominance stays elevated can attract fast rotational flow precisely because it is one of the few things actually moving.
What invalidates the bullish case: a loss of the hourly bullish regime. If H1 momentum breaks down and its RSI slips back below the midpoint, the entire bullish thesis loses its engine, because the daily was never providing structural support in the first place. A second invalidator is macro. With 24-hour market-wide volume down over 40% and sentiment stuck in Fear, an isolated altcoin rally has no reinforcement if broad risk appetite deteriorates further.
The bearish case — and what kills it
Mean reversion is arguably the higher-probability scenario on the daily chart. An RSI of 75.77 inside a neutral regime represents textbook exhaustion geometry: the move has outrun its structure. If the 15-minute pause turns into distribution and the hourly rolls, the unwind can be sharp precisely because thin liquidity cuts both ways. Fear-dominated tape with collapsing volume means fewer bids to absorb a flush.
The DeFi picture reinforces the cautious framing. DefiLlama data shows fee generation contracting hard across major venues — Uniswap V3 fees down 60.46% on the day and 36.37% over 30 days, Curve DEX down 93.13% on the day and 91.59% on the month, Ekubo down 67.49% over 30 days. Falling fee revenue signals falling on-chain activity, and falling on-chain activity is the opposite of the broad participation an altcoin rally needs to sustain itself.
What invalidates the bearish case: the daily regime flipping bullish while RSI holds above 70 rather than diverging lower. Overbought that refuses to correct is a strength signal, not a weakness one. Equally, if hourly RSI consolidates in the 55–65 zone instead of breaking down, the market is resetting rather than reversing — and shorting a reset is an expensive habit.
Positioning into the uncertainty
The practical takeaway is a hierarchy of triggers, not a direction. The hourly chart acts as the referee here. As long as it holds its bullish structure, the path of least resistance stays upward despite the stretched daily. The moment it breaks, the daily overbought condition becomes the dominant risk and mean reversion takes over. The 15-minute chart is useful only for timing entries once one of those two things resolves, and right now it is resolving nothing.
Two risks deserve to be named plainly. First, volatility is unquantified in this dataset — that is a reason to reduce exposure, not to assume calm. Second, the environment is genuinely hostile to sustained altcoin strength: Fear at 31, dominance above 56%, volume down 40%, DEX fees contracting across the board. IoTeX crypto is moving against that backdrop rather than with it, and moves made in isolation tend to have shorter half-lives. Traders comfortable with the long side should plan where they are wrong before planning where they are right; anyone leaning short needs to respect that an overbought reading has never, on its own, been a reason for a trend to end.
FAQ
Is IoTeX crypto overbought on the daily chart?
Yes. As of August 9, 2026, the daily RSI reads 75.77, which sits deep in overbought territory. However, the daily regime remains classified as neutral rather than trending, meaning the advance is fast rather than structurally confirmed. Overbought readings inside a neutral regime carry different implications than those inside a confirmed uptrend.
What market conditions are weighing on IoTeX crypto right now?
The Fear & Greed Index stands at 31, indicating Fear. Total crypto market capitalization is roughly $2.29 trillion, flat on the day, while 24-hour volume has dropped over 40%. Bitcoin dominance holds at 56.61%, showing capital remains concentrated in majors. This combination of thin liquidity and defensive positioning creates a challenging backdrop for sustained altcoin strength.
What would invalidate the bullish case for IoTeX crypto?
A loss of the hourly bullish regime would remove the engine of the current advance, since the daily chart never provided structural support. Additionally, if the Fear-dominated macro environment deteriorates further and broad risk appetite contracts, the isolated rally would lack any reinforcement from market-wide flows.
How does declining DeFi activity affect IoTeX crypto’s outlook?
DefiLlama data shows fee generation contracting sharply: Uniswap V3 fees down 60.46% on the day, Curve DEX down 93.13%, and Ekubo down 67.49% over 30 days. Falling on-chain activity signals reduced broad participation, which undermines the sustainability of any altcoin rally that depends on rotating interest and fresh capital inflows.
Disclaimer: This article is for informational purposes only and does not constitute financial advice, an investment recommendation, or a solicitation to buy or sell any financial instrument or cryptocurrency. The analysis provided is not indicative of future results. Investing in crypto assets and financial markets carries a high risk of capital loss. Always do your own research (DYOR) and consult a qualified financial advisor before making any decision.
Article produced with the assistance of artificial intelligence and reviewed by the editorial team.