Hyperliquid price has fallen below $59 after briefly crossing $60 on August 18, leaving $HYPE down around 1.4% over the past 24 hours while retaining a 7.1% seven-day gain.
CoinGecko data showed $HYPE trading near $58.49 on August 19 after reaching a 24-hour high of $60.41, with the token giving back part of a rally that had carried it from below $55 over the previous week.
Trading volume had also increased around 9% from the previous day as sellers emerged near $60.
The pullback followed several attempts to hold above $59 during August 18, when $HYPE briefly moved through $60 before losing momentum.
The token had gained around 14% during August by August 18 after recovering from $53.67 and moving back through the $57.10 area.
Part of that rally coincided with another regulatory push from the Hyperliquid ecosystem in the United States.
On August 18, the Hyperliquid Policy Center and trade[XYZ] filed a joint comment letter with the US Securities and Exchange Commission proposing a regulatory framework for pre-IPO perpetual futures.
Under the proposal, perpetual contracts tied to private companies could provide price discovery before their public listings.
Such products already trade through trade[XYZ] using Hyperliquid's HIP-3 system, while the filing presented Hyperliquid's on-chain infrastructure as a possible venue for the market.
HIP-3 allows outside developers to deploy perpetual markets after staking 500,000 $HYPE, opening the protocol to contracts tied to assets beyond cryptocurrencies.
A regulated route for pre-IPO perpetuals could therefore expand the potential use of infrastructure already operating through Hyperliquid.
On-chain activity provided another source of demand during the rally.
Blockchain data from August 18 showed a newly created wallet accumulating and withdrawing around 57,000 $HYPE, worth $3.36 million, from Coinbase.
Recent transactions also included a Maven11-linked wallet withdrawing 202,705 $HYPE, while wallets linked to Monetalis bought 171,543 $HYPE worth around $9.56 million.
Nansen recorded around $5.7 million in net $HYPE exchange outflows over seven days, reducing the amount of tokens immediately available on trading platforms.
However, the rally became overheated as $HYPE was approaching $60 especially because large players were positioned against the move.
According to Nansen data from August 18, whale, smart trader, and public-figure wallets were collectively net short $HYPE, while its funding stood at around 0.00125% per hour, leaving leveraged longs paying shorts.
Meanwhile, institutional flows had weakened as well.
$HYPE exchange-traded fund flows returned to positive territory in early August, but no additional inflows had been recorded since August 10 as of August 18.
Large holders were not uniformly accumulating either.
One whale sold 923,743 $HYPE worth around $53 million last week, while HyperLabs had unlocked 433,025 $HYPE worth around $23.5 million and gradually moved tokens towards venues including Flowdesk and OKX.
Separate data also recorded around $3.38 million entering exchanges while fresh-wallet accumulation was taking place.
With buying and selling flows competing, $HYPE reached $60.41 but failed to sustain the move, putting support areas under $60 back into focus.
$HYPE price analysis
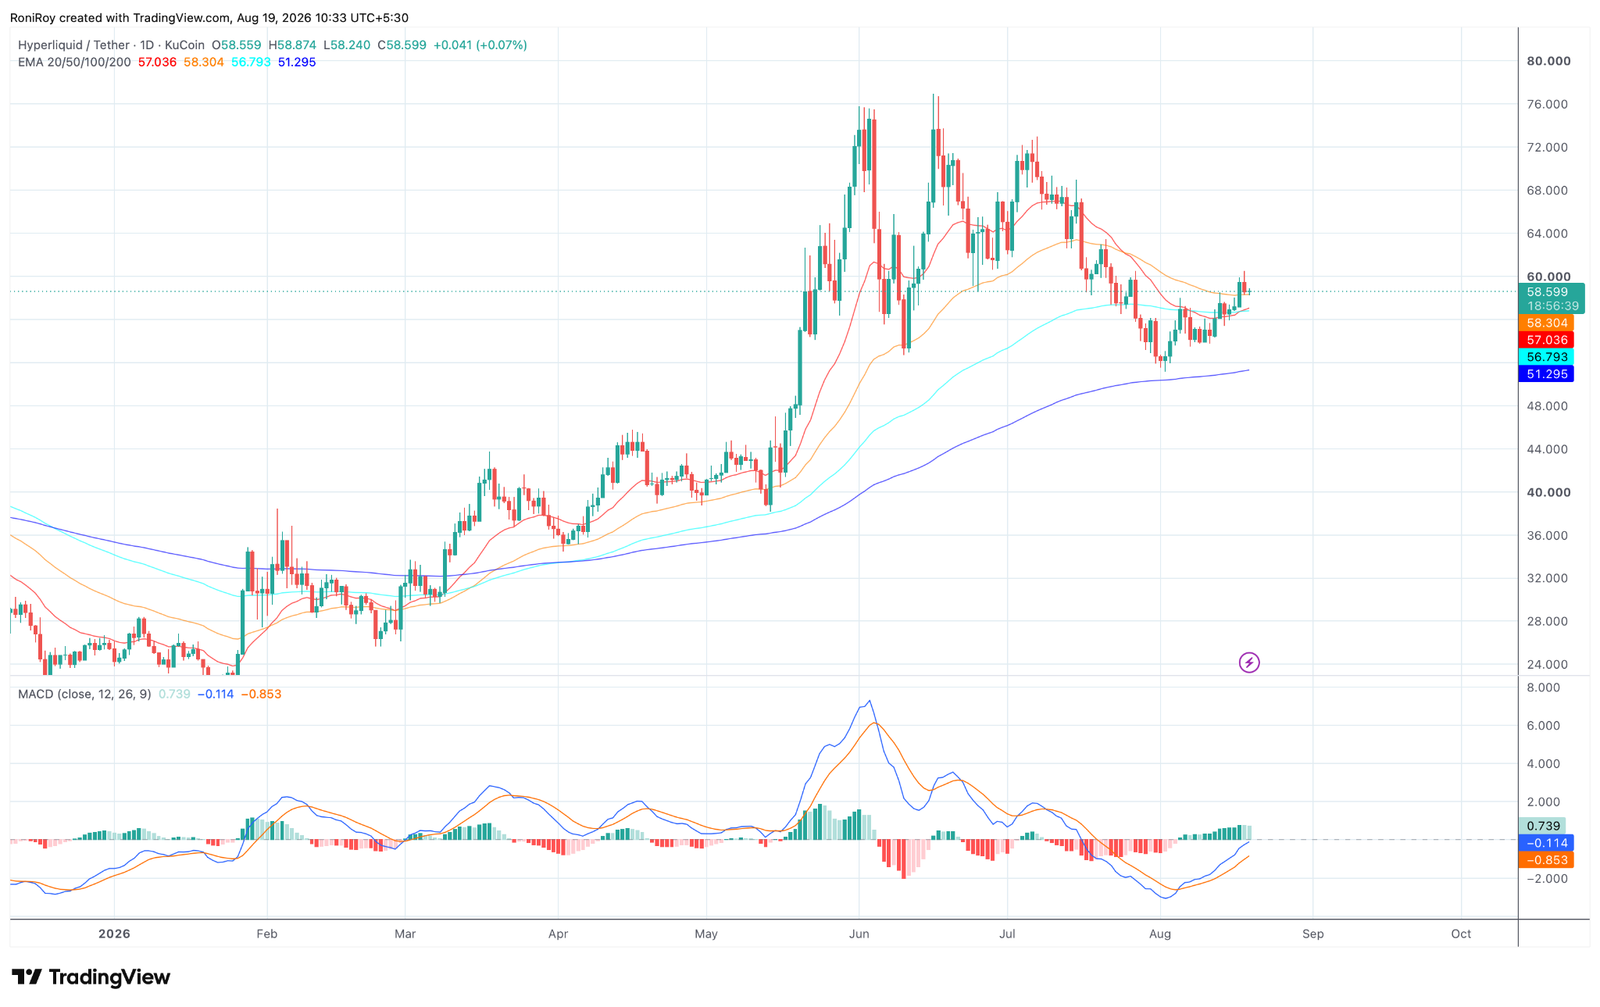
$HYPE's daily chart shows the token trading around $58.60 after recovering from its early-August low and moving back above several important exponential moving averages.
See below:
$HYPE/$USDT 1-day price chart. Source: TradingView.
The token currently sits above its 20-day EMA at $57.04, 100-day EMA at $56.79, and 200-day EMA at $51.30.
Price is also narrowly above the 50-day EMA at $58.30, making the $58.30 area an important level for maintaining the current recovery.
The arrangement is not fully bullish yet because the 20-day EMA remains below the 50-day EMA.
A sustained move above $58.30, followed by the 20-day EMA crossing back above the 50-day EMA, would provide stronger evidence that short-term momentum has recovered.
At the same time, the MACD line has crossed above its signal line, and the histogram has moved into positive territory, showing improving momentum following the rebound from the August low.
Both MACD lines, however, remain below the zero line.
$HYPE would need continued buying pressure for the indicator to move into positive territory and strengthen the case for a sustained breakout.
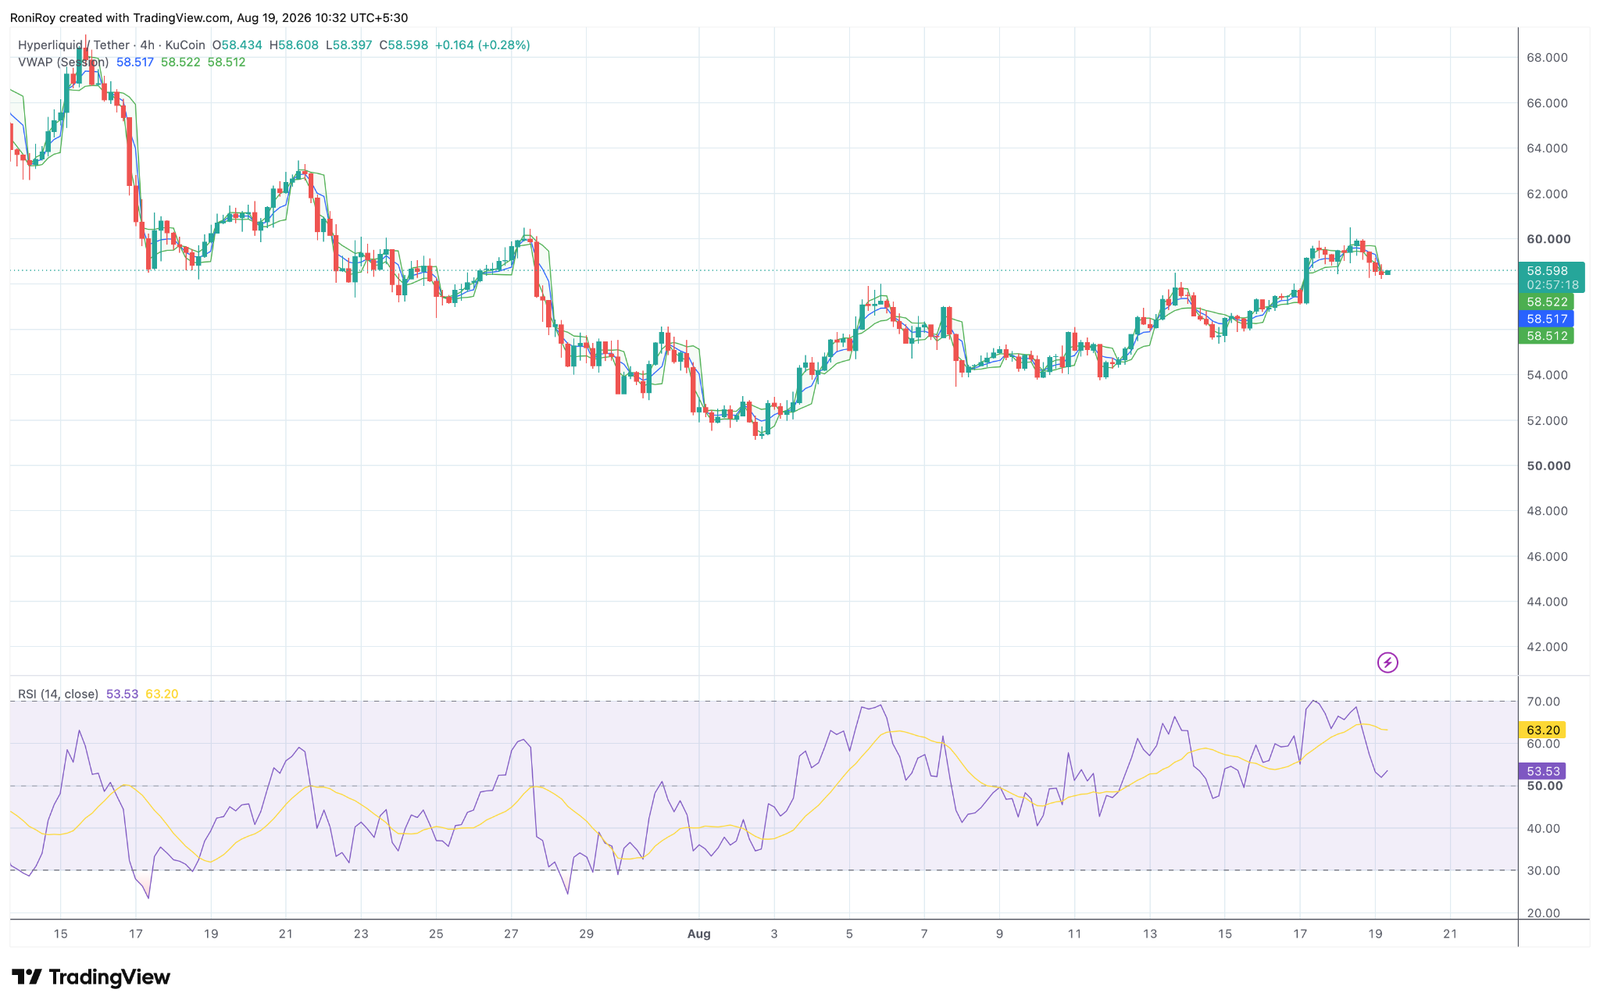
On the 4-hour chart, $HYPE's rejection from the $60 area has already reduced momentum.
$HYPE/$USDT 4-hour price chart. Source: TradingView.
The Relative Strength Index has fallen to 53.53 after moving close to the 70 overbought threshold during the latest rally.
An RSI reading above 50 still keeps momentum on the positive side, but the drop from recent highs shows that buying pressure has weakened since $HYPE tested $60.
Price is also trading close to the session VWAP at around $58.52.
Holding above the $58.30-$58.50 region would keep $HYPE around both its four-hour VWAP and daily 50-day EMA, giving buyers a base for another attempt at $60.
A break below that zone would put the 20-day EMA near $57.04 and the 100-day EMA around $56.79 into focus.
Losing both levels would weaken the recovery structure and could expose the recent support area around $53.50-$54.
For $HYPE to reclaim $60, buyers first need to keep price above the $58.30-$58.50 area and push through the recent $60.41 high.
A daily close above $60.40 would clear the resistance that rejected the August 18 rally, while sustained trading above it could bring the previous resistance region around $62 into play.