History suggests $XRP may have entered the final phase of its current bear cycle as it prints a monthly signal that previously appeared near major market bottoms.
The latest $XRP chart structure looks exactly like earlier cycle patterns that eventually led to long-term reversals and the start of strong bullish trends.
$XRP Structure Matches Previous Bear Cycle Endings
Notably, $XRP closed July below its 1-month 50-period moving average (1M MA50), represented by the blue trend line, for the second straight month. This marks the first time the asset has recorded two consecutive monthly closes below the 1M MA50 since June 2024.
Back then, $XRP still traded within its 6-year Buy Zone before launching the parabolic rally that defined the previous bull cycle. The return of this pattern now suggests the market has entered a stage that has historically appeared near the end of prolonged market corrections.
The current monthly close resembles a pattern that developed during the 2021/22 bear market. In both cases, $XRP slipped below the 1M MA50 before entering the final stage of its long-term Channel Down.
If history repeats, the next major downside level is at the 1M MA100. However, $XRP’s long-term Fibonacci Channel Up structure and the behavior of its 1-month Relative Strength Index (1M RSI) suggest the cycle low could form even lower before a sustained recovery begins.
$XRP RSI Approaches a Historically Bullish Level
For context, the 1M RSI has repeatedly produced its strongest long-term buy signals whenever it reached its Lower Lows trend line, highlighted by the green circles on the chart.
The indicator did not make direct contact with that trend line in 2022. Instead, it moved sideways, much like it did in 2020. This allowed buyers to enter slightly later while still accumulating $XRP at prices close to the cycle bottom.
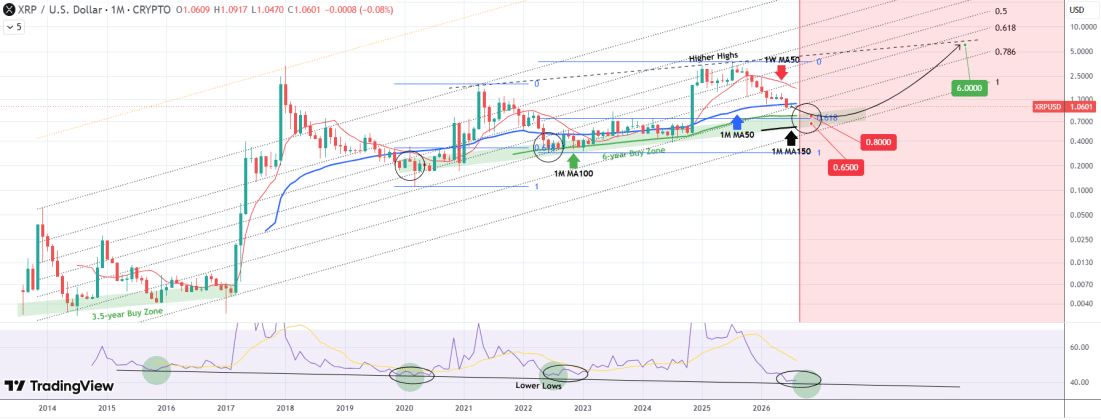
The 1M RSI now trades close to the Lower Lows trend line once again. A direct touch or another period of sideways movement could produce the next long-term buy signal. This process could still take another three to four months, but it represents the strongest long-term signal on the chart.
$XRP Could Bottom Between $0.80 and $0.65
If this timeline plays out, $XRP could move deeper into its 6-year Buy Zone before completing the current bear cycle.
The projected bottom range sits between $0.80 and $0.65. This zone covers a possible move to both the 1M MA100 and the 1M MA150, with the latter represented by the black trend line.
The lower boundary near $0.65 also falls slightly below the 0.618 Fibonacci retracement level. Notably, $XRP also formed its June 2022 bottom around that same Fibonacci retracement level, which confirms the historical support at this bottom zone.
A New Bull Cycle Could Follow
Once the current bear cycle reaches its bottom, history suggests the possibility of another extended bullish cycle.
The next bull cycle could last for a prolonged period but may feature shorter bursts of parabolic rallies, similar to $XRP’s price behavior after 2022.
For now, the Higher Highs trend line continues to limit upside momentum. Until $XRP breaks above that long-term resistance, it remains the next major target on the chart. A successful breakout above that level would open the door to an initial bull cycle target of around $6.