
$XRP slipped below the Ichimoku Cloud on the back of the latest price crash, flipping the $1.33 level to the most immediate support.
$XRP fell 9% on Sept. 15 after the CLARITY Act vote failed, pushing the cryptocurrency below the Ichimoku Cloud on its daily chart. The drop also took $XRP below $1.3300, turning an important support level into resistance.
Currently, $XRP trades around $1.3010, just above the 0.5 Fibonacci retracement at $1.2950. The sell-off has weakened several parts of $XRP’s technical structure, but some indicators still leave room for a possible recovery.
$XRP’s September Crash
$XRP entered September in a stronger position after its August rally pushed the token out of a long period of consolidation.
The move took $XRP above $1.3300, which then became an important support level after it pulled back from the $1.69 high. However, the Sept. 15 failure of the CLARITY Act vote triggered a massive sell-off, sending $XRP about 9% lower in one session.
The drop erased weeks of consolidation and pushed $XRP below $1.3300. It also weakened several technical structures that had supported the earlier rally.
By the time of this press, $XRP had fallen to around $1.3010 and was trading close to the $1.2950 0.5 Fibonacci level. The next few sessions could help in determining whether $XRP can stabilize or face another decline.
$XRP Falls Below the Ichimoku Cloud
The Ichimoku Cloud has now become one of the main technical hurdles for $XRP. On the daily chart, $XRP trades below both cloud boundaries, with Senkou Span A at $1.3850 and Senkou Span B at $1.3426.
Notably, trading below both levels gives the Ichimoku setup a bearish reading and places the cloud above $XRP as resistance.
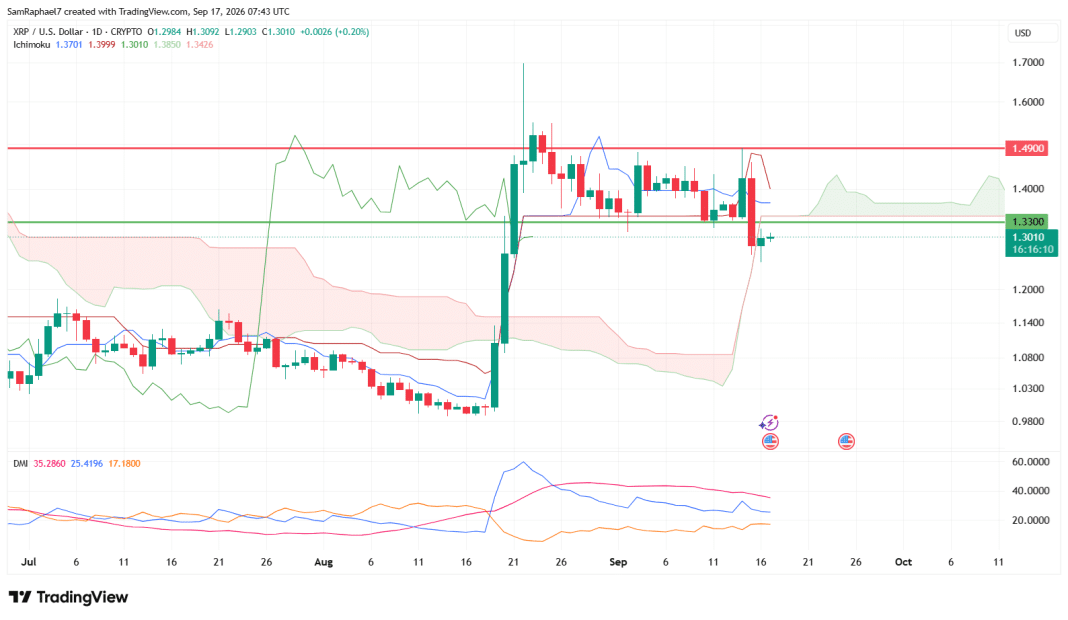
The Tenkan-sen also sits above the current price at $1.3701, while the Kijun-sen sits at $1.3999. With $XRP around $1.3010, the token remains below both lines.
This shows that $XRP has lost several important short- and medium-term levels. The Kijun-sen at $1.3999 is especially important because $XRP needs to recover above it to improve the daily chart’s technical structure.
The future cloud gives a slightly different signal. The projected Kumo is narrowing in the near term and could later twist, meaning the longer-term trend could change if $XRP improves. Before that can happen, however, $XRP needs to reclaim $1.3426 at Senkou Span B and move back into the cloud.
$1.3300 Becomes $XRP’s Key Resistance
The $1.3300 level is now critical because it had served as support after the August breakout. $XRP lost that level during the Sept. 15 crash, flipping it from support to resistance. A daily close above $1.3300 would give buyers an important technical level to work with.
Several resistance levels sit above $1.3300. Senkou Span B stands at $1.3426, while Senkou Span A rests at $1.3850 and the Kijun-sen at $1.3999.
The 0.618 Fibonacci retracement at $1.3802 also falls within this area, creating a resistance zone between about $1.38 and $1.40. Above that, $XRP faces major horizontal resistance at $1.4900.
A confirmed daily close above $1.4900 would change the current range structure. For now, though, $XRP must first recover the lower resistance levels before $1.4900 becomes a realistic focus.
$XRP DMI Shows a Strong Trend but Mixed Pressure
The daily Directional Movement Index gives a mixed view of $XRP’s current setup. The Average Directional Index stands at 35.28, above the 25 level commonly used to identify a meaningful trend. This shows that $XRP remains in a strong directional market.
Meanwhile, the +DI, which measures bullish pressure, stands at 25.41, while the -DI, which measures bearish pressure, sits at 17.18. With these figures, the +DI remains above the -DI despite the September 15 sell-off.
The -DI rose sharply during the crash but has since stabilized. At the same time, the +DI dropped during the sell-off but has managed to hold its current position. This leaves the DMI picture mixed.
$XRP Fibonacci Levels
The Fibonacci retracement drawn from $XRP’s August low of $0.9887 to its high of $1.6962 shows the key levels on both sides of the current price. At $1.3010, $XRP sits only slightly above the 0.5 Fibonacci retracement at $1.2950.
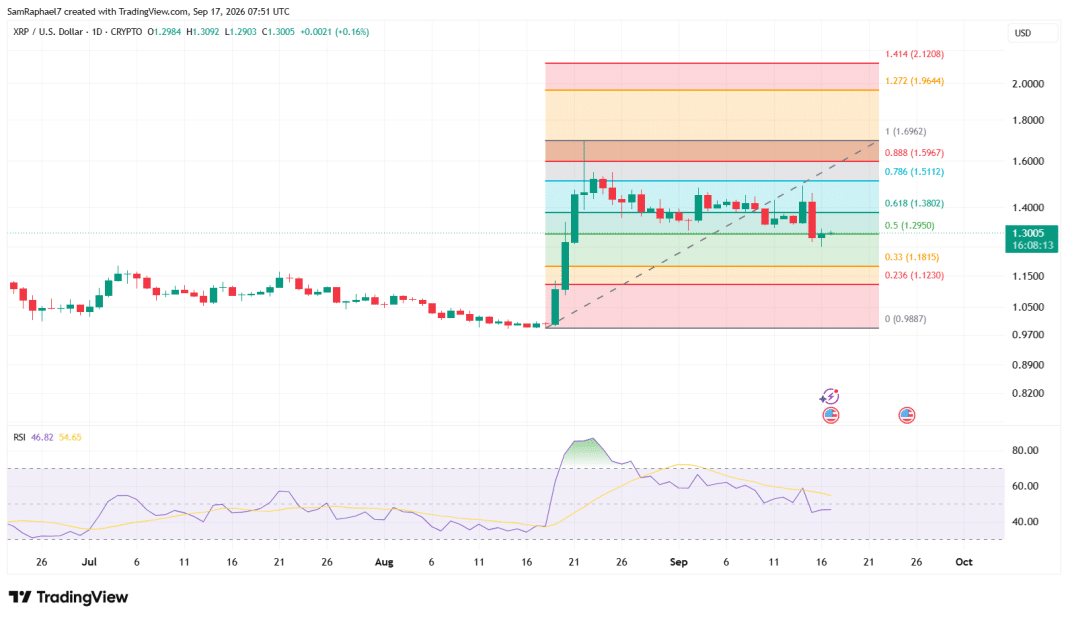
A daily close below $1.2950 could bring the next major Fibonacci level at $1.1815 into focus. That level represents the 0.33 retracement. A deeper decline could then expose the 0.236 level at $1.1230. For the current technical structure to hold, buyers need to defend the $1.2950 area.
On the upside, $XRP first needs to recover $1.3300 before it can challenge the 0.618 Fibonacci level at $1.3802. Above that, the 0.786 level sits at $1.5112, followed by the 0.888 level at $1.5967.
The longer-term Fibonacci extension targets stand at $1.9644 and $2.1208, although these levels only become relevant if $XRP first breaks convincingly above the $1.6962 August high. For now, $1.3300 remains the key level $XRP needs to reclaim after the Sept. 15 breakdown.