$XRP is trading near $1.30 in September 2026, but its price was below one cent around the same period a decade ago. Historical market data shows the scale of $XRP’s price increase over the last 10 years.
CoinMarketCap’s historical snapshot for September 16, 2016 recorded $XRP at approximately $0.007446. Data around September 17–18, 2016 also places $XRP below $0.01, far below its current price.
$XRP Rose From $0.0074 to Around $1.30
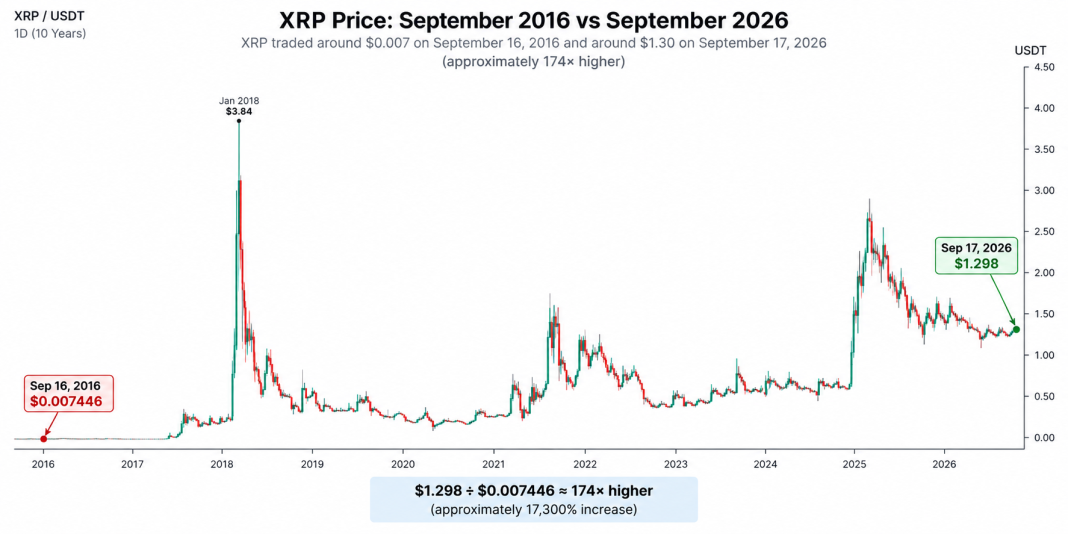
On September 17, 2026, $XRP was trading around $1.30. Investing.com recorded a price of approximately $1.3017, while a CryptoCompare-sourced dataset published by YCharts placed $XRP at $1.298.
The chart also shows $XRP at approximately $1.2945, keeping the current market price within the same $1.29–$1.30 region.
Using $1.298 as the current reference price and $0.007446 as the September 2016 reference:
$1.298 ÷ $0.007446 = approximately 174.3,
This means $1 of $XRP purchased at the September 2016 price would represent approximately $174 in market value at $1.298, excluding fees and assuming the same number of $XRP was held throughout the period.
$XRP Has Increased Roughly 17,300% in 10 Years
Measured as a percentage change, $XRP has increased approximately 17,300% between the two reference dates.
Period $XRP Price September 2016 ~$0.007446 September 2026 ~$1.298 Price multiple ~174.3× Percentage increase ~17,300%The ten-year period also included substantially higher $XRP prices. $XRP moved above $3 during the 2017–2018 crypto cycle, before falling sharply in subsequent years. The chart shows another major advance beginning in late 2024, followed by prices above $3 during 2025 and a subsequent decline toward the current $1.30 region.
Based on the cited historical and current reference prices, $XRP’s ten-year change is approximately $0.007446 to $1.298 — a gain of about 17,300%.