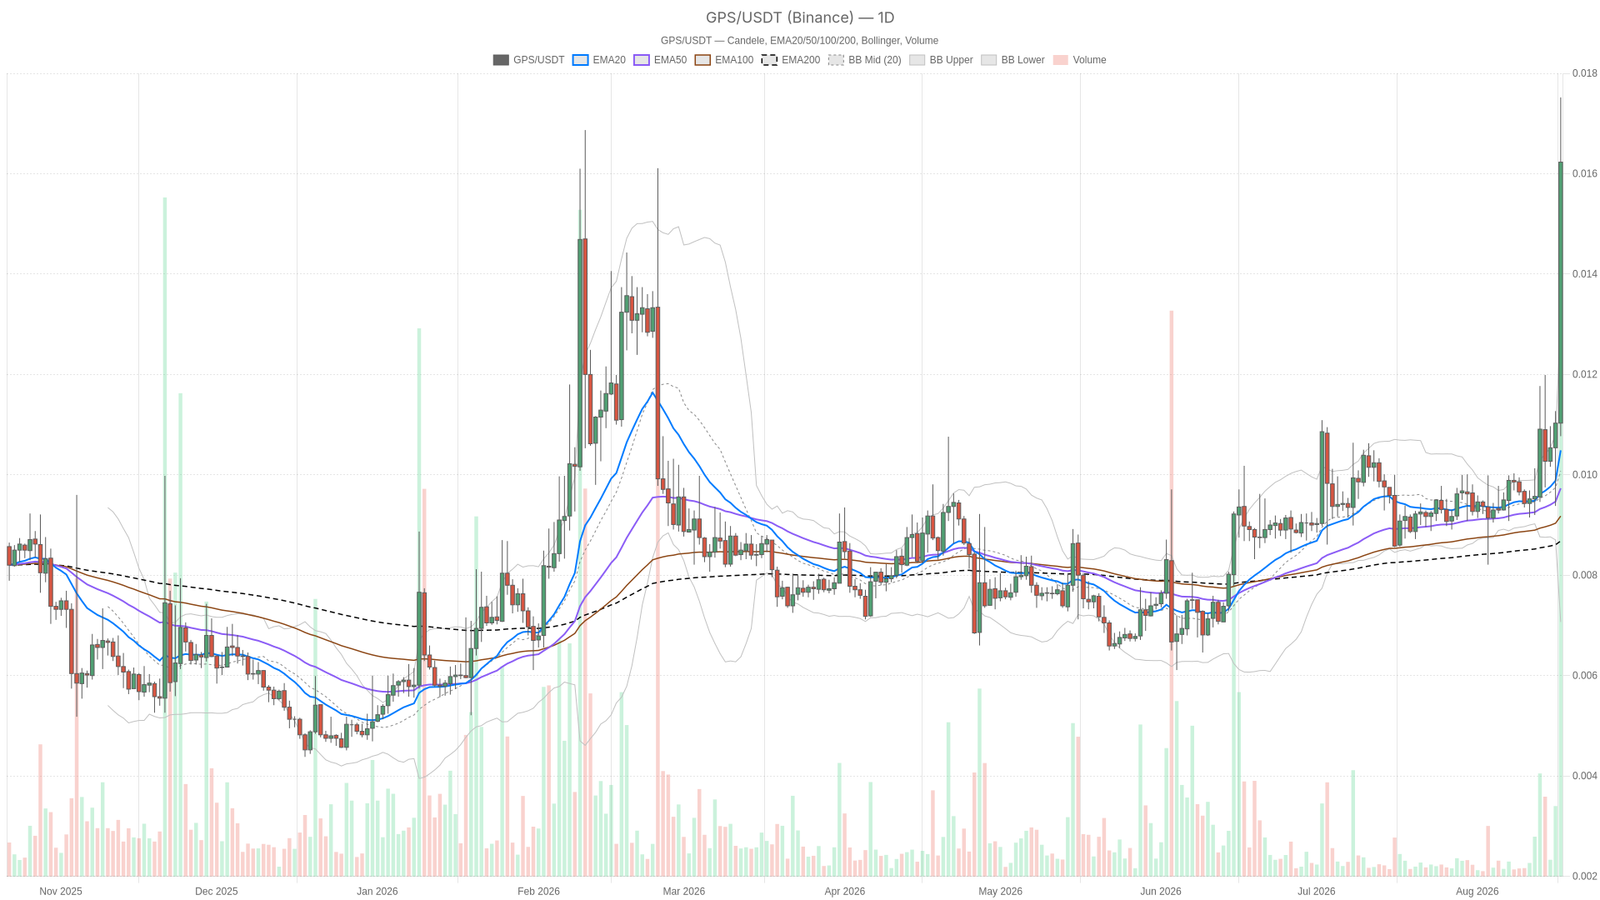
As of August 17, 2026, the $GPS token is trading at 0.02 against $USDT, well above its daily EMA20, EMA50 and EMA200 clustered near 0.01. GoPlus Security crypto has run hot and fast, now testing how far a stretched trend can go before gravity reasserts itself.
Key takeaways
- $GPS trades at 0.02 against $USDT on August 17, 2026, while its daily EMAs cluster near 0.01.
- The daily RSI reads 84.97, an extreme overbought level, even as the Fear & Greed Index sits at 31 in Fear territory.
- Total crypto market capitalization is $2.279 trillion, up 1.07% over 24 hours, with Bitcoin dominance at 56.4%.
- The 15-minute RSI has cooled to 55.07, signaling decelerating momentum despite the intact bullish structure.
- Pivot levels show price at daily R1 (0.02), with hourly and 15-minute pivots converging around 0.02.
Trend strength versus momentum exhaustion
$GPS still holds a bullish daily trend, yet its momentum is overstretched.
The daily regime for GoPlus Security crypto is classified bullish, with price above all three EMAs forming a textbook uptrend signature. However, an RSI near 85 on the daily is historically the kind of reading that precedes a cooling-off period rather than an uninterrupted continuation.
Meanwhile, on the 1-hour chart, the picture softens slightly but does not reverse. RSI reads 72.34, still overbought but less extreme than the daily print. The regime remains bullish, with price above the EMA20/50/200 stack, again clustered near 0.01 versus a 0.02 close.
The Bollinger Bands on H1 show price riding the upper band at 0.02, while the midline and lower band sit at 0.01. This squeeze-and-ride pattern often precedes either an acceleration or a snap-back once buyers stop showing up at the offer.
On the other hand, the 15-minute chart is where the fatigue becomes more visible. RSI has cooled all the way to 55.07, essentially neutral, even as EMA20 and EMA50 have both caught up to price at 0.02. Only EMA200 lags behind at 0.01.
When the lower timeframe cools off while the daily stays extended, it usually signals a pause to digest the move rather than a fresh leg higher. For execution, that argues for patience rather than chasing.
MACD, Bollinger Bands and ATR signals
MACD, Bollinger Bands and ATR give limited but consistent signals at $GPS’s current price level.
MACD readings across all three timeframes are essentially flat. At $GPS’s current price level, that likely reflects rounding at this decimal precision more than a genuine absence of momentum. It is not a bearish or bullish tell on its own. It is just a gap in the data that means traders should lean more heavily on RSI and price structure for direction.
Moreover, ATR14 shows as zero across the daily, hourly and 15-minute charts, again a function of precision at this price point rather than a claim that volatility is absent. Combined with the extreme RSI reading, it points to a move that has been compressed and fast. This is the kind of parabolic push where realized volatility has not yet shown up cleanly in the data.
Pivot levels add a bit more texture. On the daily, price at 0.02 already sits at the R1 resistance level, with the pivot point at 0.01 and R1 at 0.02. This means the market has already priced in the upside that classic pivot math would flag as the next resistance zone.
On the hourly and 15-minute charts, pivot point, R1 and S1 have all converged around 0.02. This signals the intraday range is compressing right at that resistance shelf rather than pushing cleanly through it.
Bullish and bearish scenarios for $GPS
Both a bullish continuation and a bearish mean-reversion remain valid scenarios for $GPS right now.
The bullish case rests on continuation. If buyers can defend the 15-minute EMA20/EMA50 zone around 0.02 and push volume through the R1 resistance implied by the daily pivot, the uptrend has room to extend. Price remains above every EMA on every timeframe.
Confirmation would come from RSI holding above the 50 line on the lower timeframes without a sharp reversal. It would also require a MACD histogram that turns positive rather than staying flat.
This scenario would be invalidated if price slips back below the 15-minute EMA20/EMA50 cluster and drifts toward the EMA200 near 0.01. That would suggest the breakout attempt has failed and buyers are losing control of the tape.
The bearish, mean-reversion case leans on that daily RSI print near 85. That level is rarely sustained for long without at least a partial retracement toward the EMA cluster sitting around 0.01. This would effectively mean price giving back a meaningful chunk of the recent advance.
The trigger to watch would be the hourly RSI breaking decisively below 50, alongside pivot support (S1) failing to hold.
That said, this bearish read gets invalidated if price simply holds above the 0.02 pivot zone on both the hourly and 15-minute charts. RSI would also need to stabilize rather than crash. In that case, what looks like exhaustion is just a shallow consolidation inside an intact uptrend, not a reversal.
Market context and positioning
$GPS is running hot while the broader market remains fearful rather than greedy.
It is worth noting the broader on-chain backdrop feeding into risk appetite right now. DEX fee data shows a sharp 24-hour pickup in trading activity. Uniswap V3 fees are up 83.67%, Uniswap V4 up 57.17%, and Fluid DEX up 104.28% over the same period.
However, the 30-day trend across nearly every major DEX is sharply negative. Uniswap V3 is down 44.42%, Uniswap V4 down 55.85%, Fluid DEX down 70.44%, Curve DEX down 73.47%, and Ekubo down 75.06%.
That combination fits a market that is still cautious overall, consistent with the Fear & Greed reading of 31, but capable of episodic speculative bursts into specific names. This may help explain why $GPS has managed to detach from broader sentiment and run hot on its own.
Meanwhile, total crypto market capitalization sits at $2.279 trillion, up 1.07% over 24 hours, and Bitcoin dominance is holding at 56.4%. That means capital remains concentrated at the top of the market rather than rotating aggressively into altcoins. Against that backdrop, $GPS pushing into extreme overbought territory on its own daily chart looks idiosyncratic rather than part of a broad risk-on wave.
None of this removes the basic uncertainty built into a token trading at extreme overbought extremes while the wider market remains fearful rather than greedy.
Positioning here means acknowledging both sides honestly. The daily trend structure for $GPS is bullish and intact. However, the momentum reading behind it is stretched to a degree that historically invites at least a cooling period.
Volatility at this stage of a move tends to expand in either direction once it resolves. Traders sizing into either scenario should weigh that the signals across daily, hourly and 15-minute timeframes are not fully aligned. The macro trend is up, the immediate momentum is fading, and the next few sessions should clarify which force wins out.
FAQ
What is the daily RSI reading for $GPS on August 17, 2026?
The daily RSI reads 84.97, an extreme overbought level that historically precedes a cooling-off period rather than an uninterrupted continuation.
Is the broader crypto market bullish or fearful right now?
The Fear & Greed Index sits at 31, squarely in Fear territory. Total crypto market capitalization is $2.279 trillion, up 1.07% over 24 hours, with Bitcoin dominance at 56.4%.
What are the key support and resistance levels for $GPS?
On the daily chart, the pivot point is 0.01 and R1 is 0.02, where price currently sits. On the hourly and 15-minute charts, pivot point, R1 and S1 have all converged around 0.02.
Are MACD and ATR giving clear signals for $GPS?
MACD readings are essentially flat across all timeframes, while ATR14 shows as zero, likely due to rounding at this price precision. Traders should lean more heavily on RSI and price structure.
Disclaimer: This article is for informational purposes only and does not constitute financial advice, an investment recommendation, or a solicitation to buy or sell any financial instrument or cryptocurrency. The analysis provided is not indicative of future results. Investing in crypto assets and financial markets carries a high risk of capital loss. Always do your own research (DYOR) and consult a qualified financial advisor before making any decision.
Article produced with the assistance of artificial intelligence and reviewed by the editorial team.