
The question of whether particular days of the week consistently favor bulls or bears is one that bitcoin traders frequently discuss. Although no seasonal pattern can predict future price movements, past results indicate that Friday has been the cryptocurrency market's worst trading day in recent weeks.
Friday has the biggest average decline in Bitcoin's two-week return by weekday, with losses exceeding 1 percent on average. In contrast, weekends have generally remained positive, with Tuesday showing the biggest gains.
While Monday and Wednesday also have a tendency to yield marginally negative returns, neither of them can match Friday's historical underperformance.
Why is the obvious question.
Preparing ahead of time for the weekend is one explanation. Cryptocurrency trading is open around the clock, while traditional financial markets close on Friday night. Before leaving their desks, institutional traders, market makers, and hedge funds frequently reduce risk, especially following turbulent weeks.
Selling pressure naturally increases when leveraged positions are closed or profits are taken before two days of uninterrupted trading. Futures and options markets also have an impact. Fridays are when many cryptocurrency derivatives, particularly weekly and monthly contracts, expire.
Downward movements that might otherwise remain relatively small may be amplified by the ensuing order flow. A further consideration is liquidity. Institutional desk participation progressively decreases as the trading week draws to a close.
Sharper intraday drops are more likely when there is less liquidity, because relatively small sell orders can have a greater effect on the price.
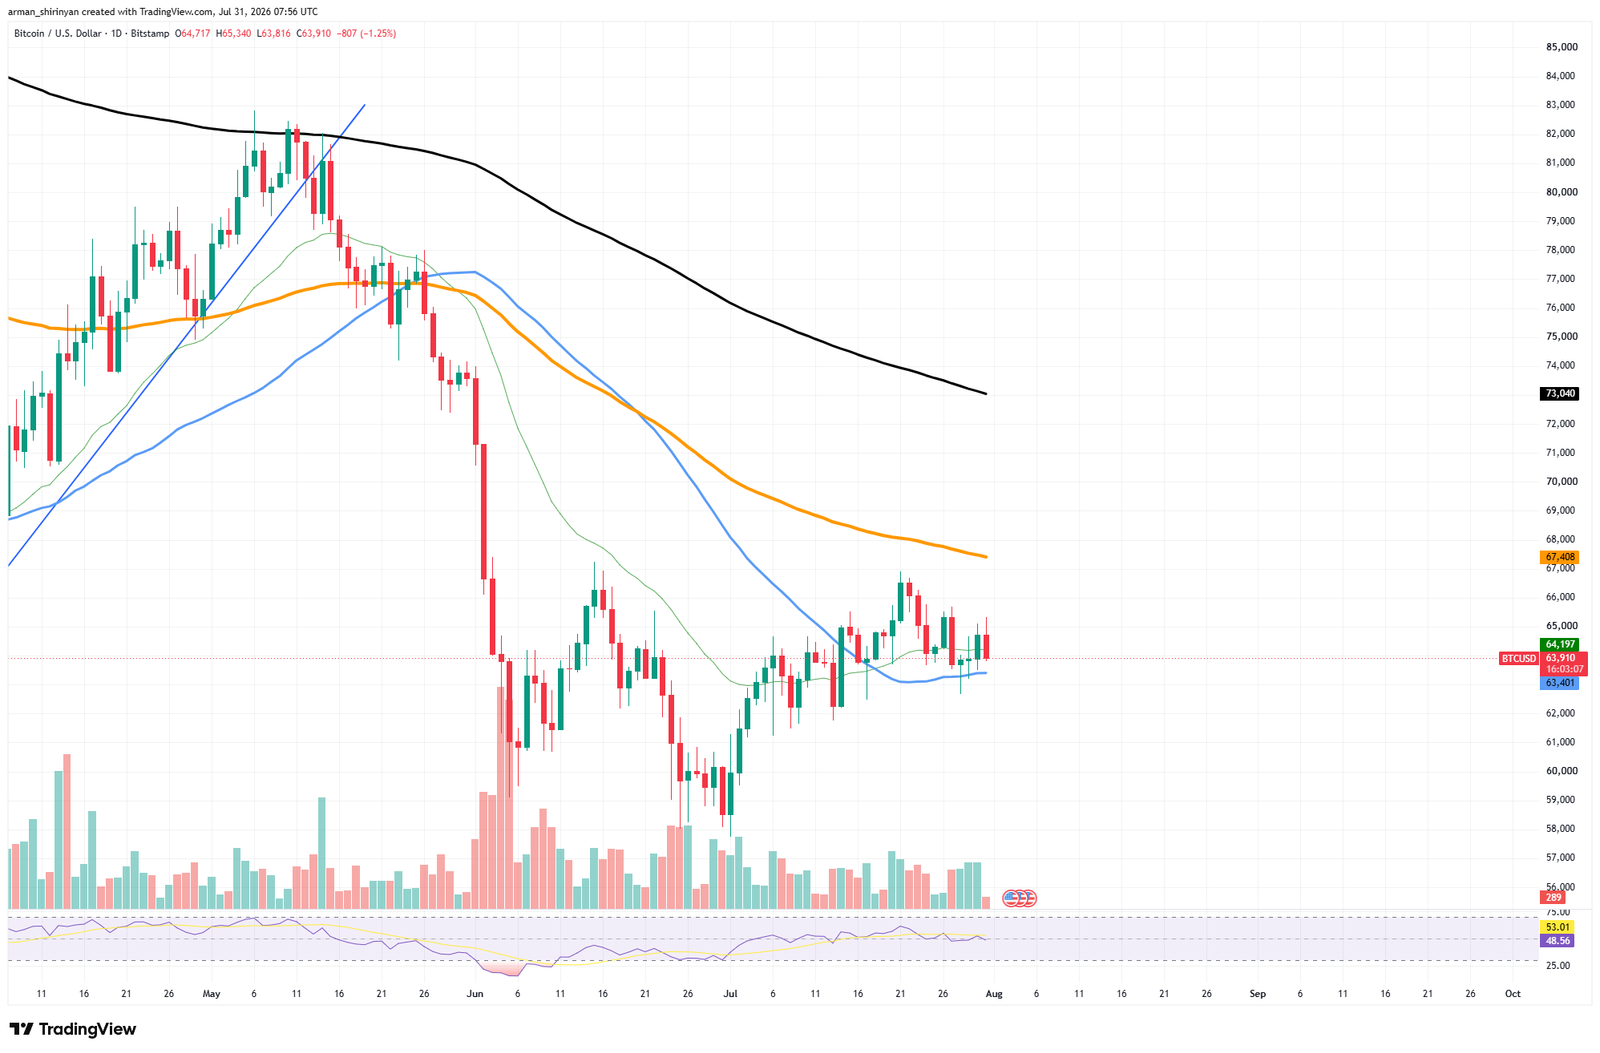
That cautious atmosphere is reflected in Bitcoin's current technical structure. The asset is currently trading at about $64,000 following yet another decline below the $67,400 50-day moving average. The overall trend is neutral to bearish even though Bitcoin is still trapped below the 50-day and 200-day moving averages, despite continuing to hold above its 100-day moving average at $63,400.
Indecision dominates
Momentum is another indicator of indecision. The Relative Strength Index is hovering near 49-50, almost perfectly neutral, indicating that neither buyers nor sellers have established meaningful control. However, historical trends by themselves should never be used as trading signals. Rather than being a weekly rule, the Friday effect is an average across numerous observations.
Any day-of-week pattern could easily be overtaken by significant macroeconomic releases, ETF flows, geopolitical developments, and liquidation events. Rather, traders should consider this tendency as one aspect of the larger picture.