$XRP is approaching a critical technical juncture after entering a 20% correction from its recent local high, with on-chain data identifying several key support and resistance levels that could shape its next move.
According to market analyst Ali Martinez in an August 29 X post, $XRP rallied 71.8% from $0.988 to $1.698 before pulling back and testing a major demand zone between $1.35 and $1.38.
Martinez noted that Glassnode’s UTXO Realized Price Distribution (URPD) data shows approximately 3.2 billion $XRP were previously traded within this range, making it one of the asset’s most significant support areas.
The concentration of trading activity around this level suggests many holders accumulated $XRP in the zone, potentially creating strong buying interest if the cryptocurrency remains above it.
The URPD data also highlights several major resistance levels above the current price. The first notable barrier sits at $1.60, where roughly 1.99 billion $XRP were traded.

Another resistance level emerges at $1.68, backed by about 1.98 billion $XRP in historical volume.
The most significant resistance appears at $1.86, where approximately 3.47 billion $XRP previously changed hands.
This represents the largest concentration of trading activity above the current support zone and could act as a major hurdle for bulls attempting to regain momentum.
If $XRP successfully defends the $1.35-$1.38 support region and reclaims higher resistance levels, analysts believe a move above $1.86 could open the door to further gains.
Beyond that level, Martinez noted that the next major target is $2.19, where another 3.12 billion $XRP were traded, according to the URPD data.
$XRP price analysis
A sustained breakout above $1.86 would indicate buyers have absorbed a significant amount of overhead supply, increasing the likelihood of a rally toward the $2.19 area.
At press time, $XRP was trading at $1.39, down nearly 6% over the past week.
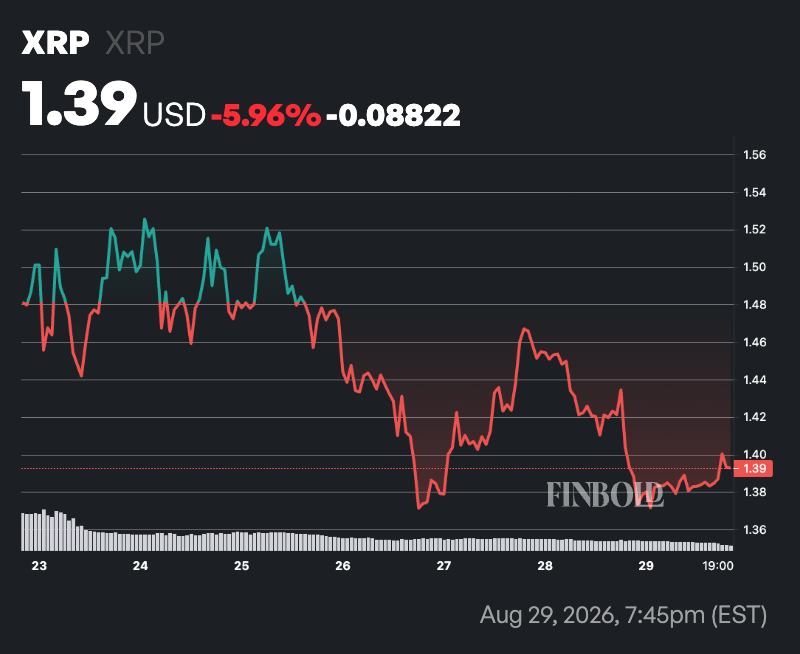
Despite the recent correction, $XRP remains technically bullish, trading above both its 50-day SMA of $1.13 and 200-day SMA of $1.28. This positioning suggests the broader uptrend remains intact, with both moving averages likely acting as support during pullbacks.
Meanwhile, the 14-day RSI stands at 64.75, just below the overbought threshold of 70. The reading indicates strong buying momentum while suggesting $XRP may be nearing a zone where upside could become more limited in the short term if buying pressure accelerates further.
Featured image via Shutterstock