$XRP could be heading toward a deeper correction after closing July below its monthly 50-period moving average (MA) for the second consecutive month.
According to an outlook shared by TradingShot in a TradingView post on August 4, this marks the first time $XRP has recorded two straight monthly closes below the 1M MA50 since June 2024.
At that time, the cryptocurrency was still trading within its long-term accumulation range before the previous bull market rally.
Based on historical patterns, TradingShot argues that this development signals the final phase of $XRP’s bear cycle and could pave the way for a decline toward the $0.80 to $0.65 range.
If realized, the move would represent a drop of roughly 25% to 40% from current levels.
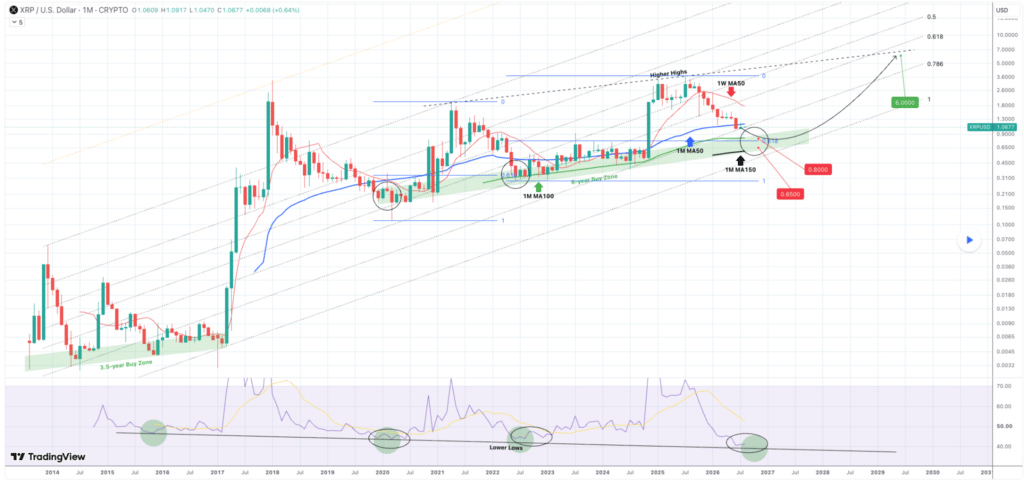
According to the analyst, previous bear market structures suggest $XRP is now entering a phase similar to the 2021-2022 downturn. During that cycle, the price eventually found support around its monthly 100-period moving average (1M MA100).
The outlook also highlighted a long-term Fibonacci channel-up structure that has guided $XRP’s price action for years. Within that framework, TradingShot identified a potential bottom zone between $0.80 and $0.65, an area that overlaps with the asset’s six-year buy zone.
Notably, the upper end of that range aligns with a possible test of the 1M MA100, while the lower boundary coincides with the monthly 150-period moving average. Meanwhile, the $0.65 target sits just below the 0.618 Fibonacci retracement level that marked $XRP’s June 2022 bottom.
Signal from $XRP RSI
TradingShot also highlighted the monthly RSI, noting that $XRP’s strongest long-term buy signals have historically emerged when the indicator reaches its descending lower-lows trendline, as seen near the 2020 and 2022 cycle bottoms.
With the RSI approaching that level again, the analyst believes a new buy signal could emerge within three to four months, although further downside may occur first.
Previous RSI lows also coincided with $XRP trading inside its long-term accumulation zone before major rallies.
Although the near-term outlook remains bearish, TradingShot expects a new bull cycle to follow once the correction ends.
The analysis identifies a long-term higher-highs resistance trendline as the key hurdle, with a breakout potentially opening the door to a move toward $6.
$XRP price analysis
By press time, $XRP was trading at $1.07, up about 0.5% over the past 24 hours and 1.5% on the weekly timeframe.
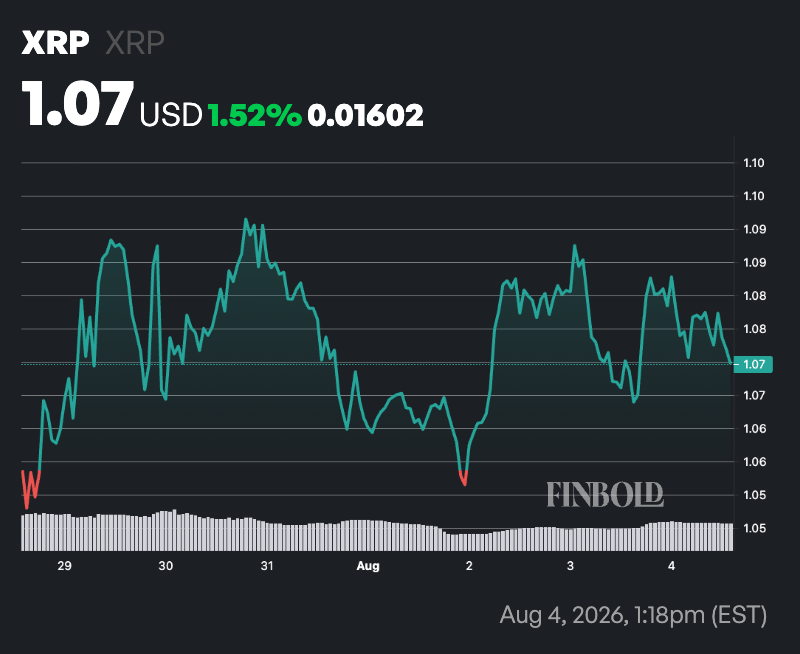
However, the cryptocurrency remains under technical pressure, trading below both its 50-day SMA of $1.10 and 200-day SMA of $1.35, signaling that the broader trend remains bearish.
At the same time, the 14-day RSI stands at 45.43, a neutral reading that remains below the key 50 level, indicating bearish momentum is still present despite $XRP not being oversold.
Overall, the moving averages continue to point to a downtrend, while the RSI suggests there is still room for additional price movement before a stronger reversal signal emerges.