
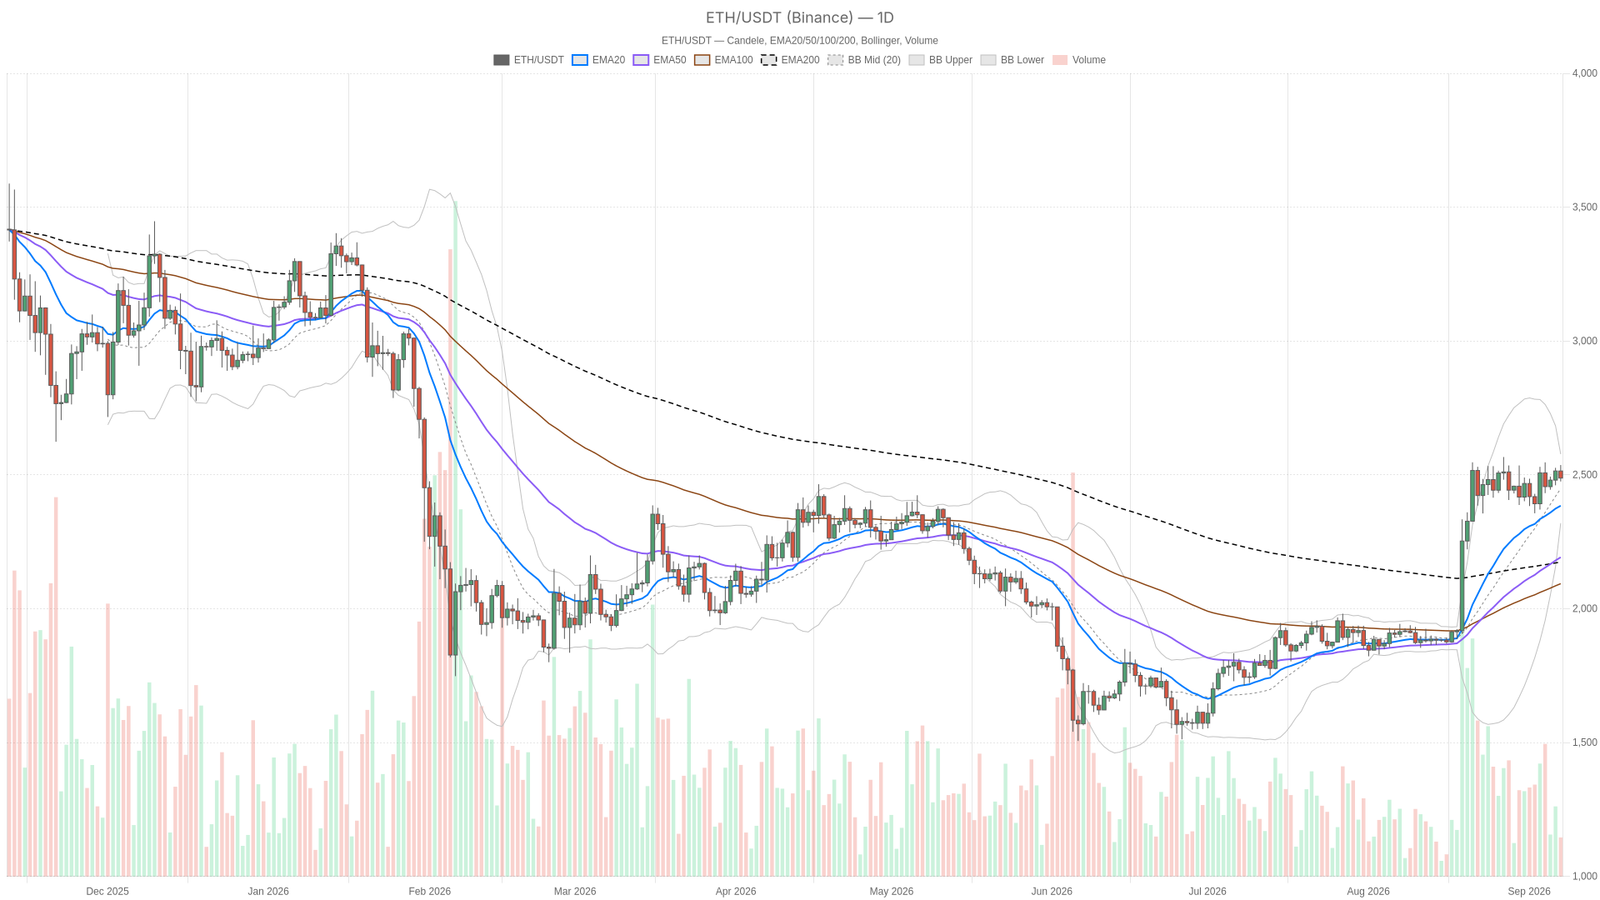
Market data from September 7, 2026 shows the Ethereum price today holding at $2,487.96, keeping $ETH inside a bullish daily structure even as shorter timeframes flash caution. Total crypto market capitalization sits near $2.69 trillion after a sharp -3.15% decline over the past 24 hours, with Bitcoin dominance at 59.14%.
Key takeaways
- $ETH trades at $2,487.96, above the daily EMA20, EMA50, and EMA200 in a stacked bullish alignment that attracts trend-following buyers.
- Daily RSI14 at 63.14 still leaves room to run, but the MACD histogram at -13.32 signals that upward momentum is decelerating.
- The 1-hour chart has flipped neutral: price sits below the EMA20 and EMA50 with RSI14 dropping to 44.49.
- Fear & Greed Index at 71 (Greed) contrasts with a -3.15% market-wide contraction and sharp DEX fee declines across major venues.
- 15-minute ATR14 at just 6.34 versus 93.27 on the daily suggests a directional decision is approaching soon.
Daily Trend Remains Bullish Despite Cooling Momentum
The daily regime is classified as bullish, with price at $2,487.96 trading above a cleanly stacked moving average structure: EMA20 at $2,384.61, EMA50 at $2,192.06, and EMA200 at $2,174.05. That alignment tends to attract trend-following buyers rather than scare them off. RSI14 on the daily sits at 63.14, comfortably in bullish territory without approaching exhaustion, which suggests there is still room to run before overbought conditions become a concern.
However, the MACD tells a more nuanced story. The line sits at 112.39 against a signal of 125.71, producing a negative histogram reading of -13.32. Momentum remains technically positive since the line itself is above zero, yet it is clearly decelerating. The bullish push that built this trend is losing steam even though the structural stack has not broken — a classic late-trend signature.
Meanwhile, Bollinger Bands on the daily show the mid-band at $2,448.31, with the upper band at $2,577.24 and the lower band at $2,319.39. Price trading above the mid-band but well inside the channel suggests an orderly trend rather than a parabolic one, with no immediate squeeze or breakout pressure. ATR14 at 93.27 confirms daily volatility remains elevated relative to price. The daily pivot structure places the pivot point at $2,499.91, with resistance at R1 ($2,524.69) and support at S1 ($2,463.17) — useful reference points for determining whether the next move is a genuine breakout or simply noise inside the range.
Lower Timeframes Show Momentum Has Already Flipped
Momentum has already turned on the lower timeframes, with the 1-hour chart shifting to neutral. Price at $2,487.02 now trades below the EMA20 ($2,495.89) and just barely under the EMA50 ($2,489.75), though it remains above the EMA200 ($2,467.75). RSI14 has dropped to 44.49 — under the 50 midline — marking a meaningful shift from the daily’s 63.14 reading. The MACD line at -0.29 versus a signal of 2.51 produces a histogram of -2.8, confirming that short-term momentum has genuinely turned negative, not merely paused.
Similarly, the 15-minute timeframe echoes the same caution. The regime is neutral, with RSI14 at 40.63, a MACD histogram at -0.52, and price at $2,486.84 sitting below both the EMA20 ($2,494.21) and EMA50 ($2,498.04). The Bollinger mid-band on the 15m rests at $2,496.07, with bands stretching from $2,479.15 to $2,512.99 — a tight, compressed range that suggests coiling rather than trending. ATR14 at just 6.34 confirms volatility has contracted sharply compared to the daily’s 93.27, which typically precedes a directional decision.
Market Sentiment Diverges from On-Chain Activity
The Fear & Greed Index reads 71, classified as Greed — an odd fit against a 24-hour market cap decline of -3.15%. That mismatch usually means sentiment has not caught up with price action yet, or that the drop is being interpreted as a dip-buying opportunity rather than a trend change. Either way, it signals that positioning is stretched relative to what the tape is actually doing right now.
On-chain activity data adds another layer of caution. Uniswap V4 fees dropped -52.02% in a single day and -37.02% over seven days, while Uniswap V3 fell -64.04% in 24 hours. Curve DEX dropped -60.32% daily and -44.64% over the week, and Fluid DEX slid -57.97% daily. Ekubo was the outlier, up 96.04% over seven days despite a -51.28% single-day drop. Taken together, this represents a broad, same-day pullback in decentralized exchange fee revenue across nearly every major venue — consistent with the hesitation showing up in $ETH’s hourly momentum readings.
Bullish Scenario
The case for continuation rests entirely on the daily structure holding firm. If $ETH can defend the daily pivot zone around $2,463–$2,499 and reclaim the 1H EMA20/EMA50 cluster near $2,490–$2,496, the stalled hourly momentum could resolve into a fresh push toward daily R1 at $2,524.69. From there, a test of the upper Bollinger Band near $2,577.24 becomes realistic. For this to play out, however, RSI on the lower timeframes must climb back above 50 and the 1H/15m MACD histograms need to flip positive, confirming the pause is merely a pullback within the larger bullish daily regime.
Bearish Scenario
Conversely, the case for further downside centers on the daily MACD histogram continuing to widen negative, currently at -13.32, while price loses the EMA20 support at $2,384.61. If the hourly weakness spreads and $ETH breaks below the daily S1 level at $2,463.17, that would open the door toward the daily EMA50 near $2,192.06 as the next real structural support — a much deeper pullback than anything implied by the current range-bound 15m price action. The sharp drop in DEX fee activity and the -3.15% market cap decline provide macro backing for this scenario.
What This Means for Traders
Right now, the Ethereum price today reflects a still-intact daily uptrend running into short-term momentum that has clearly cooled. That is not automatically bearish — trends pause all the time — but it does mean chasing strength on the lower timeframes carries more risk than the daily chart alone would suggest. The Fear & Greed reading at 71 shows sentiment has not fully priced in the broader market’s contraction, and the synchronized drop in DEX fees across Uniswap, Curve, and Fluid points to genuine cooling in on-chain activity. Volatility compression on the 15m, with ATR14 at 6.34 versus 93.27 on the daily, indicates the market is building toward a decision point rather than drifting sideways indefinitely. Staying aware of both sides of this tension matters more than picking a direction prematurely.
FAQ
Is Ethereum’s daily trend still bullish?
Yes, the daily trend remains classified as bullish. $ETH at $2,487.96 trades above a stacked moving average structure — EMA20 at $2,384.61, EMA50 at $2,192.06, and EMA200 at $2,174.05 — with RSI14 at 63.14 still in bullish territory. However, the MACD histogram at -13.32 indicates momentum is decelerating.
Why is hourly momentum fading while the daily trend holds?
On the 1-hour chart, $ETH has slipped below both the EMA20 ($2,495.89) and EMA50 ($2,489.75), with RSI14 dropping to 44.49. The MACD histogram at -2.8 confirms short-term momentum has turned negative. This divergence is common during late-trend phases, where the macro structure remains intact but the immediate buying pressure exhausts itself temporarily.
What are the key support levels to watch for Ethereum?
The immediate support sits at the daily S1 level of $2,463.17 and the pivot zone around $2,499.91. Below that, the daily EMA20 at $2,384.61 provides the next structural floor. A deeper pullback would target the daily EMA50 near $2,192.06, which represents the next significant support zone.
Disclaimer: This article is for informational purposes only and does not constitute financial advice, an investment recommendation, or a solicitation to buy or sell any financial instrument or cryptocurrency. The analysis provided is not indicative of future results. Investing in crypto assets and financial markets carries a high risk of capital loss. Always do your own research (DYOR) and consult a qualified financial advisor before making any decision.
Article produced with the assistance of artificial intelligence and reviewed by the editorial team.