
As of August 24, 2026, $ETH trades at $2,468.47, with the Ethereum price today caught between its daily pivot and the resistance band capping recent sessions. This comes days after Bitcoin and ether surged on Trump’s call for Congress to pass the crypto Clarity Act.
Key takeaways
- Ethereum trades at $2,468.47 as of August 24, 2026, pinned between the daily pivot at $2,455.76 and R1 resistance at $2,486.80.
- Daily RSI sits at 79.2, deep in overbought territory, while hourly momentum shows signs of fatigue with a thinning MACD histogram.
- Total crypto market cap stands at $2.62 trillion, down 0.67% over 24 hours, with Bitcoin dominance near 59.2%.
- The Fear & Greed Index reads 73 (Greed), a level that often precedes either a breakout leg or a sharp reset.
- Uniswap V3 fees surged 393.23% over seven days, signaling strong on-chain activity that cooled in the most recent session.
Daily Strength Versus Hourly Fatigue: A Market at a Crossroads
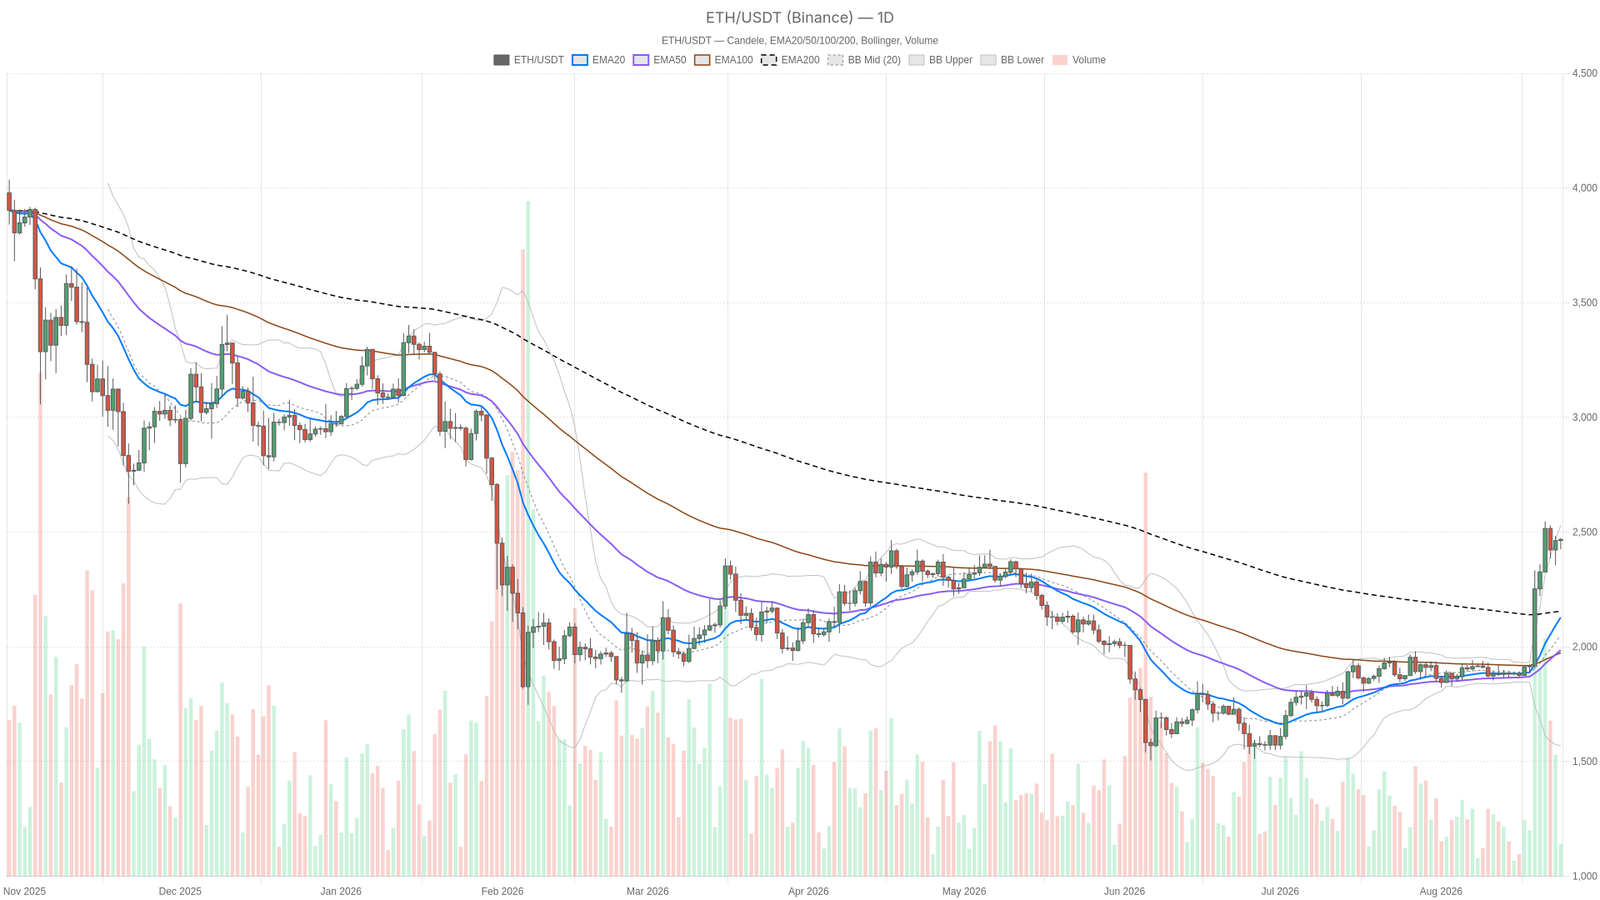
Ethereum is currently overextended on the daily timeframe, with RSI at 79.2 and price pressing against the upper Bollinger Band, while shorter timeframes show momentum beginning to fade. The daily chart sets the macro bias, and right now it’s flashing an overextended uptrend rather than a calm one. Ethereum is trading well above its daily EMA50 at $1,986.20 and EMA200 at $2,155.86.
However, the EMA20 at $2,128.57 sits below the EMA200. This unusual stack shows price ran higher faster than its own short-term average could adjust. That is the fingerprint of a sharp, fast rally, not a slow grind. The daily MACD backs this up with a wide histogram of 61.03, confirming genuinely strong momentum. Yet extended momentum like this does not run forever without at least a pause.
Bollinger Bands on the daily reinforce the same story. Price at $2,468.47 presses close to the upper band at $2,530.47, well above the mid-band at $2,049.95. That is a market riding the edge of its own volatility envelope, not consolidating in the middle of it. The daily ATR of $99 gives a sense of scale. A $99 average daily range means the current setup is not just technically stretched. It is stretched with real volatility behind it. The daily pivot structure shows price sitting just above pivot at $2,455.76, testing the road toward R1 at $2,486.80 rather than comfortably clearing it.
Hourly and 15-Minute Charts: Where the Cracks Start to Show
The hourly chart reveals a market still trending bullishly but running out of thrust, with RSI at just 58.63 and a MACD histogram that has thinned to 0.44. The EMA stack is clean and textbook bullish. EMA20 at $2,445.07 sits above EMA50 at $2,426.64, which sits above EMA200 at $2,236.37. Yet the MACD line at 7.19 is barely ahead of its signal at 6.75. That is a market still trending but losing its edge.
Hourly Bollinger Bands show price hugging the upper band at $2,473.47 without much room to breathe. The hourly pivot structure has price parked just above pivot at $2,465.88, inside a narrow band rather than pushing decisively toward R1 at $2,476.48. On the 15-minute chart, price is pinned against the upper Bollinger Band at $2,468.44 and sits just below its own pivot at $2,468.64. EMAs are stacked bullish and RSI at 60 shows short-term buyers remain active. But this is a market at a decision point, not one with room to run before proving itself.
The tension across timeframes is real. The daily chart says overbought and due for at least a pause. The hourly says the trend is intact but tiring. And the 15-minute chart says the next few candles will decide which read wins.
On-Chain Activity: A Mixed Signal Worth Noting
On-chain data shows a strong weekly build-up in Ethereum activity that cooled sharply in the most recent session, mirroring the push-and-pause dynamic visible in price action. Uniswap V3 fees jumped 393.23% over seven days even after an 18.55% one-day pullback. Uniswap V4 fees rose 115.55% over the same weekly window despite a similar daily dip. Curve DEX fell 71.22% in 24 hours but remains up 24.07% over the week. This paints a picture of genuine demand that simply eased off in the latest session rather than reversing.
Bullish Scenario
A breakout above the daily R1 at $2,486.80 with expanding hourly MACD momentum would open the path toward the upper daily Bollinger Band near $2,530.47. If Ethereum clears that level alongside the hourly R1 near $2,476.48, and the MACD histogram starts expanding again, the extended daily trend has room to stretch further. A sustained hold above the daily pivot at $2,455.76 and hourly S1 at $2,457.66 would keep buyers firmly in control.
Moreover, continued attention around policy catalysts like the Clarity Act could keep sentiment, already at Greed levels, feeding the move rather than fading it. This scenario is invalidated if price fails to hold the daily pivot and slips back below $2,455.76 with conviction.
Bearish Scenario
The overbought daily RSI at 79.2 combined with fading hourly momentum creates a classic setup for mean reversion rather than continuation. A loss of the 15-minute pivot at $2,468.64 followed by a rejection at the upper Bollinger Band could trigger a slide toward the hourly EMA50 at $2,426.64 or the daily S1 at $2,437.44.
A deeper unwind would target the daily EMA20 at $2,128.57 or EMA200 at $2,155.86. However, that would require a much larger move than current price action suggests is imminent. This bearish read is invalidated if Ethereum reclaims and holds above the daily R1 at $2,486.80, signaling the overbought condition is being resolved through continuation rather than correction.
Positioning and Risk
Right now, the Ethereum price today reflects a market that has rallied fast and is now pausing to determine whether it has more upside to deliver or needs to digest recent gains. The daily trend is genuinely strong, but strength that outruns its own averages and pushes RSI into the high 70s does not usually go in a straight line from here. Some give-back or sideways digestion is a normal part of this kind of move, not necessarily a reversal signal. With daily ATR near $99 and hourly ATR near $23, swings in either direction over the next sessions could be sharp relative to the tight pivot ranges currently in play on the shorter timeframes.
Sentiment sitting in Greed territory at 73 adds a layer of crowding risk. Markets this confident can extend further, but they can also unwind quickly once momentum stalls. The honest takeaway is that this is a market with real strength behind it, but also real fatigue showing up under the surface. Both need to be respected rather than resolved into a single confident call.
FAQ
What is Ethereum’s price today?
As of August 24, 2026, Ethereum trades at $2,468.47, positioned between its daily pivot at $2,455.76 and the first resistance band at $2,486.80.
Is Ethereum overbought right now?
Yes, the daily RSI stands at 79.2, which is deep in overbought territory. However, the hourly RSI at 58.63 remains neutral, creating a tension between timeframes that makes the next move uncertain.
What are the key support and resistance levels for Ethereum?
Key resistance sits at the daily R1 of $2,486.80 and the upper Bollinger Band near $2,530.47. Key support lies at the daily pivot of $2,455.76, with further support at the daily S1 of $2,437.44 and the hourly EMA50 near $2,426.64.
What does the Fear & Greed Index at 73 mean for Ethereum?
A reading of 73 places the market firmly in Greed territory. While this signals strong bullish sentiment, it also introduces crowding risk. Markets this confident can extend further or unwind sharply if momentum stalls.
Disclaimer: This article is for informational purposes only and does not constitute financial advice, an investment recommendation, or a solicitation to buy or sell any financial instrument or cryptocurrency. The analysis provided is not indicative of future results. Investing in crypto assets and financial markets carries a high risk of capital loss. Always do your own research (DYOR) and consult a qualified financial advisor before making any decision.
Article produced with the assistance of artificial intelligence and reviewed by the editorial team.