
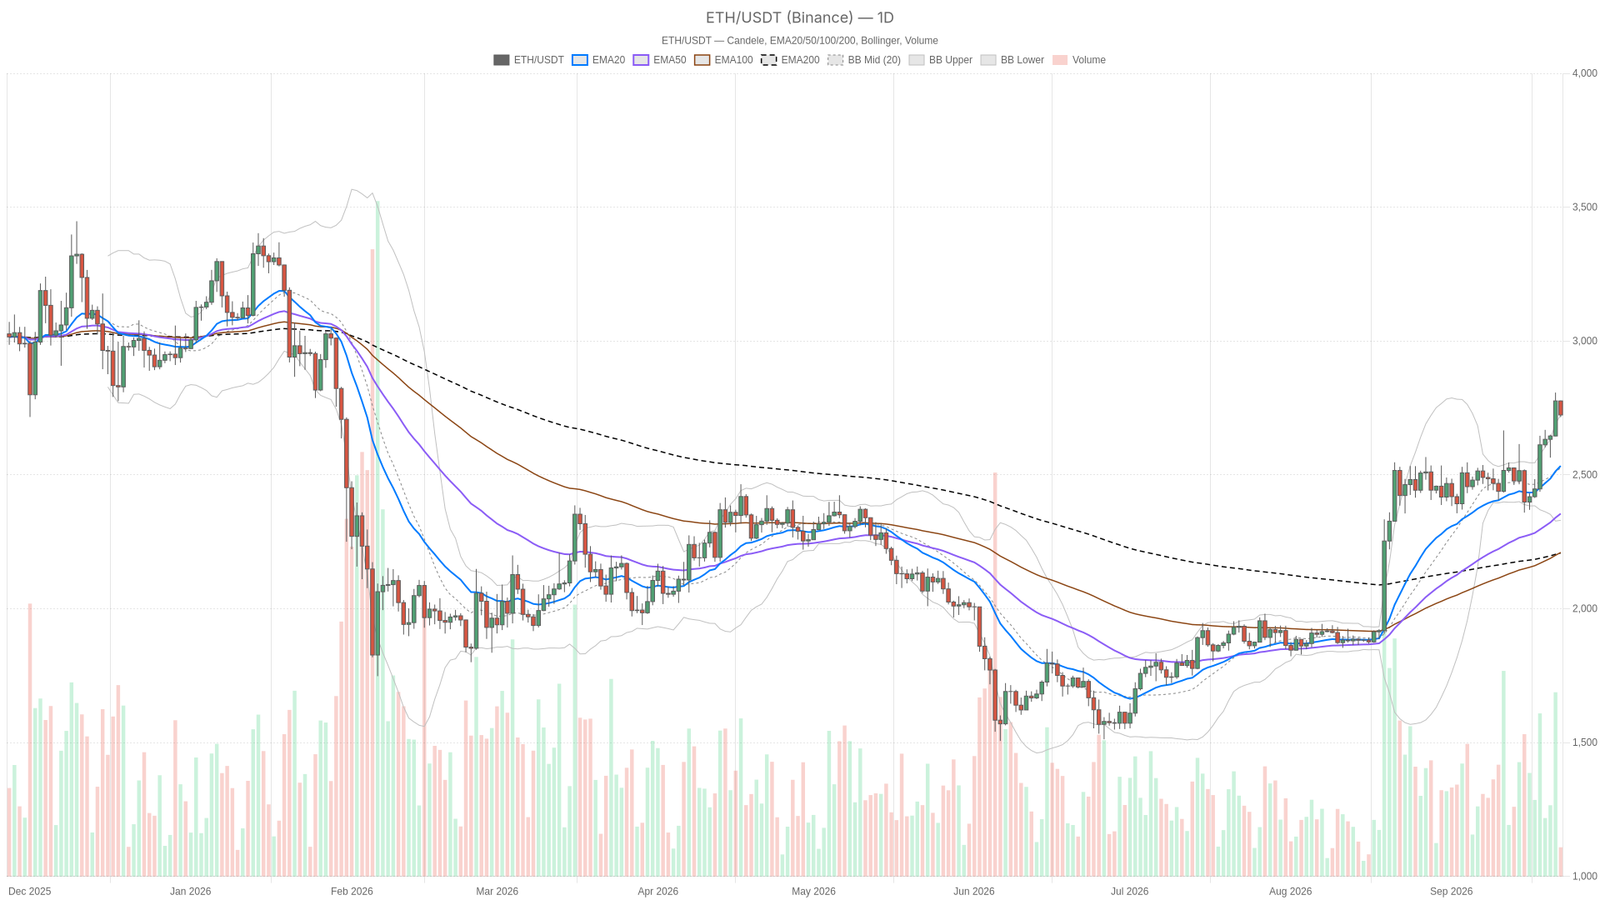
The tension between daily bullish structure and an hourly pullback defines the current Ethereum price today setup, with $ETH hovering at $2,723.66 as of September 22, 2026 — a level that places it almost precisely on its daily Bollinger upper band at 2,722.84.
Key takeaways
- Ethereum trades at $2,723.66, riding its daily Bollinger upper band with RSI at 66.99 and a textbook EMA20/50/200 bullish stack.
- The hourly chart tells a more cautious story: RSI at 48.95, MACD histogram negative at -8.75, and price drifting toward the lower 1H Bollinger band.
- Total crypto market cap sits at roughly $2.904 trillion, up 0.58% in 24 hours, with Bitcoin dominance near 58.78%.
- Uniswap V4 fees surged 81.54% daily and Uniswap V3 fees jumped 192.43%, signaling real on-chain demand beyond pure price speculation.
- The Fear & Greed Index reads 78 (Extreme Greed), while daily ATR14 of 108.79 confirms $100+ intraday swings are the current norm.
The Daily Chart Still Belongs to the Bulls
The daily chart presents a remarkably clean trend structure. Price at $2,723.66 sits above the EMA20 at 2,533.41, which sits above the EMA50 at 2,354.97, which sits above the EMA200 at 2,208.21 — a textbook bullish stack where every short-term average outranks the next. That kind of alignment reflects sustained buying pressure over weeks, not a single green candle.
RSI14 on the daily stands at 66.99. Elevated and close to overbought territory, it hasn’t broken 70 yet, so this reads more as strong momentum than exhaustion — for now. The MACD line at 95.13 remains comfortably above the signal line at 80.16, with a histogram of 14.98 that’s still expanding rather than rolling over. In plain terms, the trend-following momentum on the daily hasn’t cracked.
The Bollinger Band setup adds nuance: mid-band at 2,526.43, upper band at 2,722.84, lower band at 2,330.03. Price hugging the upper band while RSI stays under 70 often signals a trending market riding the band rather than one about to reverse hard. However, upside from here becomes harder to sustain without a pause or a shallow pullback to reset. Daily ATR14 of 108.79 confirms this isn’t a quiet market — swings of over $100 a day are the norm right now. The daily pivot at 2,739.04, with resistance at 2,762.17 and support at 2,700.53, frames the near-term battlefield. Price sitting just under the pivot suggests buyers haven’t fully cleared that first hurdle yet.
The Hourly Chart Tells a Different, More Cautious Story
On the 1H chart, price at 2,723.67 is sitting below its EMA20 at 2,734.67 but above its EMA50 at 2,696.02 — a classic pullback pattern inside an otherwise intact uptrend. RSI14 on the hourly has cooled to 48.95, essentially neutral, showing that the aggressive daily momentum has lost some steam at this smaller resolution.
More telling is the MACD on the 1H: the line at 12.09 is now below the signal at 20.84, producing a negative histogram of -8.75. That’s short-term bearish momentum building directly against the daily trend — a real divergence worth respecting rather than dismissing. The hourly Bollinger Bands, with mid at 2,749.31, upper at 2,784.15, and lower at 2,714.47, show price drifting toward the lower band, reinforcing that sellers have had control over the past several hours. ATR14 here is 20.25, and the 1H pivot cluster is unusually tight — pivot at 2,727.29, R1 at 2,731.05, S1 at 2,719.91 — which typically precedes a decisive move once price picks a side.
15-Minute View: Execution Context Only
Zooming into the 15-minute chart, RSI14 has slipped to 37.51, approaching oversold without quite getting there. Price trades under both its EMA20 at 2,734.49 and EMA50 at 2,741.11 but still above the EMA200 at 2,700.08. The MACD histogram has ticked up to a barely positive 0.5 even though the line at -6.33 remains below the signal at -6.83 — a small hint that intraday selling pressure may be running out of fuel, though it’s far too early to call it a reversal. This timeframe is useful for timing entries or exits around the tight pivot zone of 2,721.96–2,726.95, not for making directional bets.
Bullish and Bearish Scenarios
The bullish case rests on the daily structure holding. If $ETH defends the 1H EMA50 near 2,696 and the daily S1 at 2,700.53, then reclaims the 1H EMA20 at 2,734.67 and pushes back through the daily pivot at 2,739.04, the road toward R1 at 2,762.17 opens up, keeping the EMA20/50/200 bullish stack fully intact. This scenario would be invalidated by a daily close back below 2,700.53 — losing that support would put the recent breakout attempt in doubt and shift attention toward the daily EMA20 near 2,533 as the next real test.
The bearish case leans on the hourly divergence extending. If sellers keep pressing while the 1H MACD histogram stays negative and 15m RSI slides toward oversold, price could retest the 1H EMA50 at 2,696.02 and then the daily S1 at 2,700.53. A deeper move would expose the daily EMA20 around 2,533.41 if that support also fails. This scenario loses credibility the moment $ETH reclaims the 1H EMA20 at 2,734.67 with the MACD histogram flipping back positive — that would suggest the pullback was just noise inside the bigger trend.
Sentiment and On-Chain Flows Add Another Layer
The Fear & Greed Index reads 78, classified as Extreme Greed. That’s not a warning sign by itself, but paired with a daily RSI near 67, it’s worth keeping in mind — extended greed readings have a habit of coinciding with either strong continuation moves or sharper-than-expected pullbacks once momentum stalls.
On-chain activity gives some support to the bullish case. According to DefiLlama data, Uniswap V4 fees jumped 81.54% in 24 hours and 65.21% over 30 days, while Uniswap V3 fees spiked 192.43% in a single day. Fluid DEX posted a similar 192.41% one-day gain. That kind of surge across Ethereum’s largest DEX venues suggests real trading demand is flowing through the network right now, not just price speculation. Curve DEX is the outlier, with fees down 45.13% in 24 hours and a steep 81.55% drop over 30 days — a sign that activity has rotated away from stablecoin-heavy pools while $ETH’s volatility has picked up elsewhere.
Where This Leaves Traders
Ethereum price today is a case of two timeframes disagreeing just enough to matter. The daily chart is unambiguously bullish — trend, momentum, and structure all point the same way. The hourly chart is telling a more cautious story, with momentum fading and price testing lower Bollinger territory. Neither view cancels the other out; they simply describe different time horizons, and that’s exactly the kind of setup where volatility tends to pick up once one side wins the argument.
With daily ATR running near $109, sharp intraday swings should be treated as normal rather than alarming. The tight pivot ranges on both the 1H and 15m charts suggest the market is coiling before its next real decision, and an extreme greed reading of 78 is a reminder that sentiment can shift quickly once price stalls. Anyone tracking this move should weigh the daily trend against the hourly warning signs rather than leaning on just one timeframe — and size any exposure with the current volatility, not the headline optimism, in mind.
FAQ
What is the Ethereum price today?
As of September 22, 2026, Ethereum trades at $2,723.66, sitting almost exactly on its daily Bollinger upper band at 2,722.84.
Is Ethereum’s daily trend bullish?
Yes. The daily chart shows a textbook bullish EMA stack (20/50/200), with RSI at 66.99 and an expanding MACD histogram — all pointing to sustained upward momentum.
Why does the hourly chart look more cautious?
The 1H chart shows price below its EMA20, RSI at a neutral 48.95, and a negative MACD histogram at -8.75. This indicates short-term bearish momentum building against the daily uptrend.
What on-chain signals support the bullish case?
Uniswap V4 fees surged 81.54% in 24 hours, Uniswap V3 fees jumped 192.43%, and Fluid DEX posted a 192.41% daily gain — all suggesting real network demand beyond speculation.
Disclaimer: This article is for informational purposes only and does not constitute financial advice, an investment recommendation, or a solicitation to buy or sell any financial instrument or cryptocurrency. The analysis provided is not indicative of future results. Investing in crypto assets and financial markets carries a high risk of capital loss. Always do your own research (DYOR) and consult a qualified financial advisor before making any decision.
Article produced with the assistance of artificial intelligence and reviewed by the editorial team.