
The decrease in leveraged trading suggests investors are reducing their exposure to the market.
However, the continued inflows into US spot Ethereum exchange-traded funds (ETFs) indicate institutional demand remains resilient.
Ethereum Open Interest dips as market retraces
Ethereum's derivatives market has shown renewed momentum in recent days.
After hitting the $29 billion mark earlier this week (its highest since June 7), the futures Open Interest (OI) has declined by 1.3% in the last 24 hours and now reads $27.3 billion.
Meanwhile, perpetual futures funding rates have remained mostly positive throughout July but weakened this week. On Thursday, funding briefly turned negative for the first time since late June.
A negative funding rate suggests short sellers are paying long traders, indicating growing bearish positioning.
While rising leverage can fuel stronger rallies, it also increases the risk of sharp liquidations if prices move unexpectedly.
Institutional demand for Ethereum continues to improve despite recent price weakness.
According to CoinGlass, US spot Ethereum ETFs recorded $14.9 million in net inflows on Thursday, extending their winning streak to four consecutive trading sessions.
The continued inflows suggest institutional investors remain interested in Ethereum even as short-term price momentum slows
Retail and institutional sentiment within the United States presents a mixed picture.
The Coinbase Premium Index, which measures the price difference between Coinbase and other major exchanges, has remained below zero for nearly three months.
A negative premium generally signals weaker buying demand from US-based spot investors.
Analysts often view a sustained move back into positive territory as a sign that broader bullish sentiment is returning to the market.
Ethereum technical outlook: 100-day EMA remains key resistance
The $ETH/USD 4-hour chart remains bullish despite the price decline over the past 24 hours.
At press time, Ethereum is still trading above both its 20-day EMA at $1,837 and the 50-day EMA at $1,829.
These moving averages continue to provide near-term support.
However, bullish momentum faces a major hurdle at the 100-day Exponential Moving Average (EMA) near $1,937, which has repeatedly capped recent recovery attempts.
Momentum indicators remain moderately positive. Relative Strength Index (RSI) is around 55, indicating steady buying momentum without entering overbought territory.
The MACD lines are also within the positive territory but risk dropping lower if the selling pressure persists.
If buyers regain momentum and push above immediate resistance, $ETH could target the initial resistance at $1,909 and the 100-day EMA of $1,937.
A daily candle close above this EMA could pave the way for Ethereum to extend its rally towards the $2,108 and $2,107 resistance levels.
On the downside, traders would be watching important support levels such as the 20-day and 50-day EMAs.
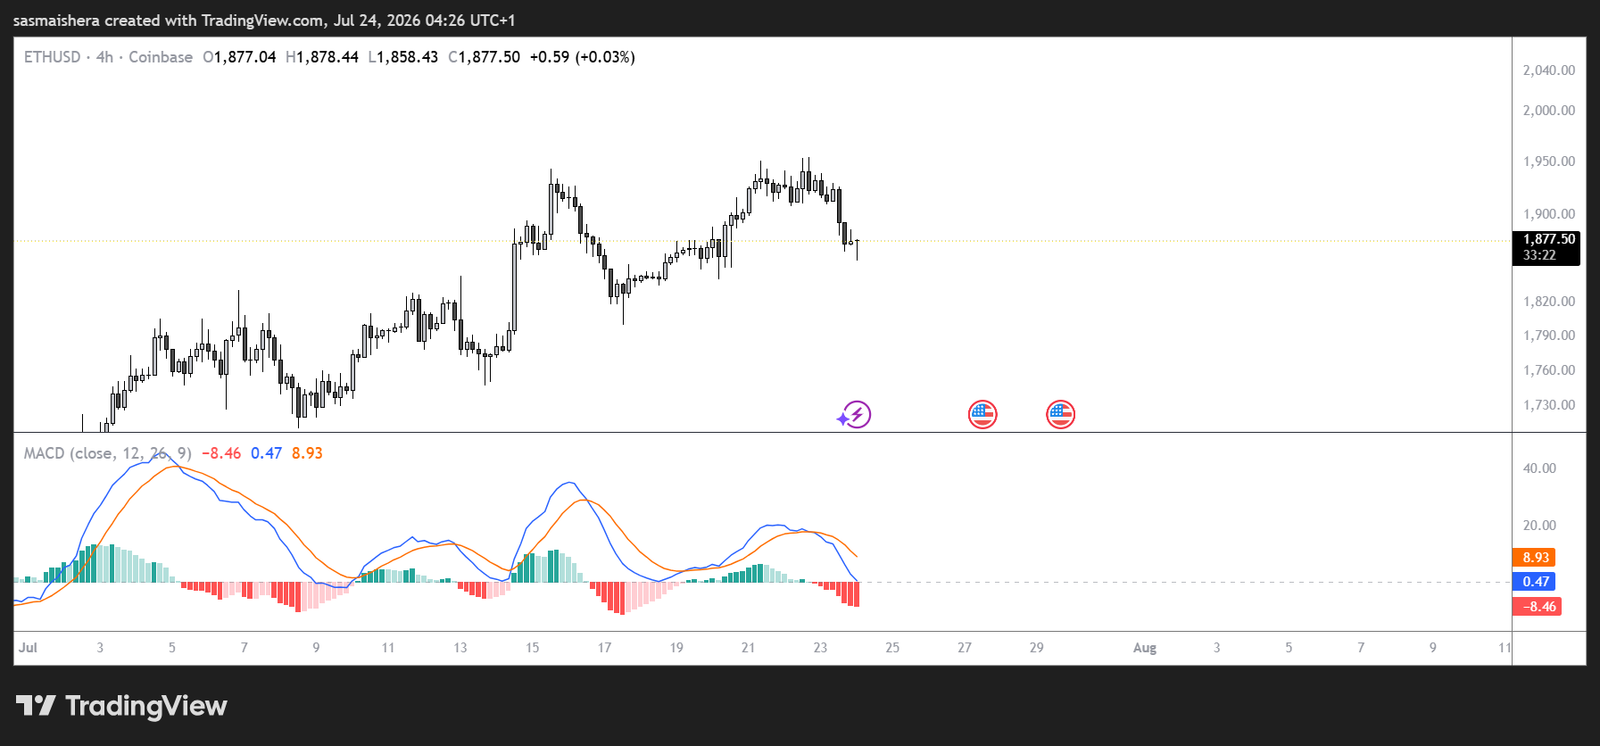
A decisive close below these levels could push $ETH towards the next major support zone at $1,741 in the near term.
The structural resistance at $1,524 needs to be protected if the bulls want to ensure that the current recovery doesn’t get weaker.