
Ethereum trades at $1,855.77 on July 20, down 0.81%, holding above the 20-day EMA after its first week of meaningful ETF inflows since the June breakdown. The daily chart now carries a Fibonacci extension framework with clearly defined targets, and a weekly roadmap from a closely followed analyst is mapping a path from current price to levels not seen since the 2021 bull market.
Fibonacci Levels Are Now The Roadmap For $ETH’s Recovery
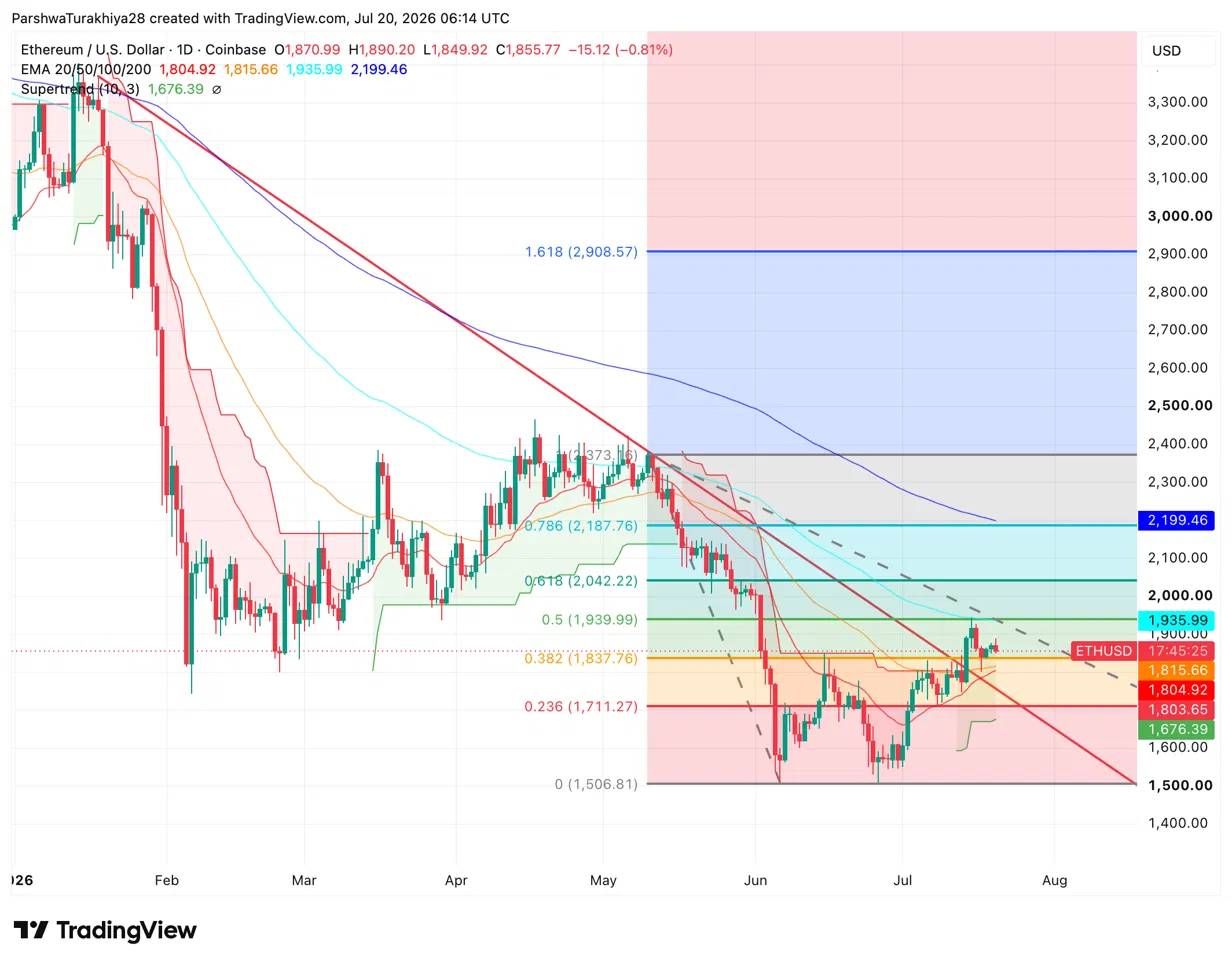
The daily chart shows $ETH recovering from its $1,506 June low with a Fibonacci retracement and extension grid now active from that base. Price currently sits between the 0.236 level at $1,711 and the 0.382 level at $1,837, with the Supertrend at $1,676.39 providing bullish support below. The 20-day EMA at $1,804.92 and 50-day at $1,815.66 have converged into a tight support band just below current price, and holding above both on a daily close is what keeps the recovery structure intact.
The 0.5 Fibonacci level at $1,939.99 aligns almost exactly with the 100-day EMA at $1,935.99, making that zone the first meaningful resistance test above. Clearing it opens the 0.618 at $2,042.22, then the 0.786 at $2,187.76. The 1.618 extension at $2,908.57 is the bull case target if the recovery extends into a full trend reversal. The 200-day EMA at $2,199.46 sits between the 0.786 and the 1.618, adding another layer of resistance around the $2,200 area.
What Are The Key Support And Resistance Levels For $ETH Today?
- Support at $1,804.92 on the 20-day EMA and $1,676.39 on the Supertrend
- Resistance at $1,939.99 on the 0.5 Fibonacci level and 100-day EMA
- Extended resistance at $2,042.22 on the 0.618 and $2,187.76 on the 0.786 Fibonacci
- Bull case target at $2,908.57 on the 1.618 Fibonacci extension
- Key floor at $1,506.81 at the Fibonacci zero point and June low
The Weekly Chart That Has $ETH Bulls Watching 2027
Ethereum roadmap.
— Celal Kucuker (@CelalKucuker) July 19, 2026
$1,500✅ →$1,800✅ → $1,200 ? → $2,300 → $1,955 → $2,900 → $3,600 → $2,880 → $4,300 → $6,330+
When everyone loses hope, the rally is usually just around the corner.
2026 will be the year $ETH prints a new ATH.
Bookmark this. We'll revisit it. pic.twitter.com/jt969otQCn
Analyst Celal Kucuker published a weekly $ETH chart laying out a full cycle price roadmap. The map traces a path from the current $1,500 to $1,800 base through a potential dip toward $1,200, followed by a recovery sequence with clearly defined sequential waypoints.
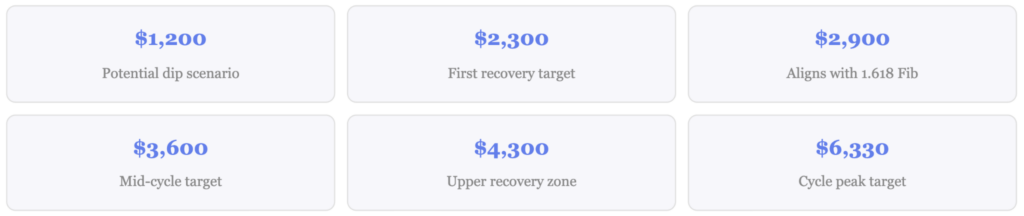
The weekly chart shows $ETH at the bottom of a long-term ascending channel, with the lower trendline providing support near current price and the upper trendline projecting to the $6,000 area around 2027. Kucuker’s core argument is that 2026 will be the year $ETH prints a new all-time high, pointing to the historical pattern where capitulation sentiment precedes rather than confirms a bottom. Current negative $ETH sentiment fits that template.
Spot ETF Inflows Return With BlackRock Doing The Heavy Lifting
US spot Ethereum ETFs logged $105M in net inflows for the week of July 13-17, the strongest weekly reading in recent months. BlackRock’s ETHA drove the bulk of it at $135M for the week, bringing its cumulative total to $113.1B.
Fidelity’s FETH recorded a $21.56M outflow, offsetting some of the BlackRock gains. Total net assets across all spot $ETH products now stand at $9.97B, representing 4.48% of Ethereum’s total market cap. The return of institutional ETF demand at the same time price holds above the 20-day and 50-day EMA cluster adds weight to the case that the June low was a durable floor rather than a pause in the downtrend.
What Derivatives Show About Current Positioning
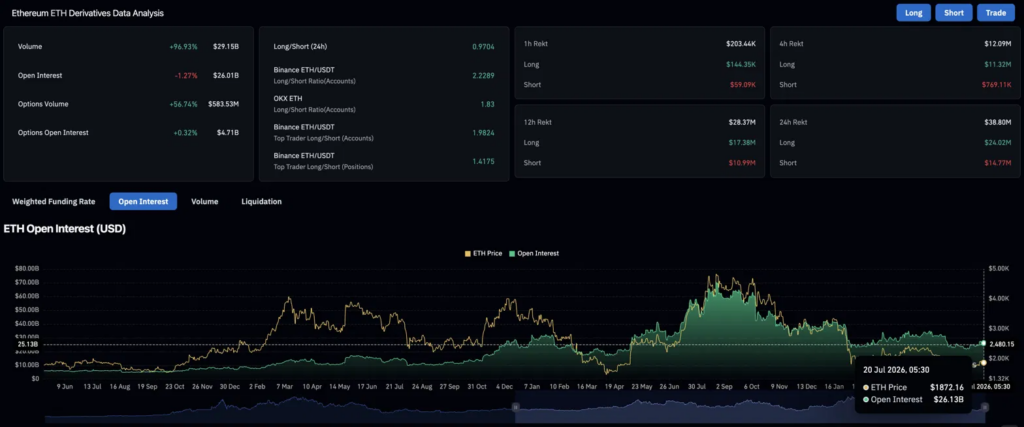
Volume nearly doubled at 96.93% to $29.15B while open interest slipped 1.27% to $26.01B, a split pointing to active trading rather than fresh positioning. Options volume jumped 56.74% to $583.53M with options open interest holding at $4.71B, suggesting traders are hedging around near-term price direction rather than committing to directional bets.
Long liquidations over 24 hours hit $24.02M against $14.77M for shorts, a more balanced flush than recent sessions, with neither side in control. Top traders on Binance hold a 1.98 long/short ratio on accounts and 1.42 on positions, both net long heading into the week.
Ethereum Price Prediction: Upside and Downside Targets
- Upside case: $ETH holds the 20-day EMA at $1,804.92, ETF inflows extend into a second consecutive positive week, and price clears the 0.5 Fibonacci and 100-day EMA at $1,939.99 toward the 0.618 level at $2,042.22 as the Celal Kucuker roadmap’s early targets begin to play out.
- Downside case: The 20-day and 50-day EMA cluster fails, $ETH slips back toward the Supertrend at $1,676.39, and the weekly roadmap’s projected $1,200 dip scenario becomes the more relevant path if macro pressure returns and ETF flows reverse.