
Ethereum’s RSI is flashing the same warning seen before earlier local tops, but its strength against Bitcoin is improving. A confirmed $ETH/$BTC breakout could signal a wider reversal and support stronger momentum across the altcoin market.
Ethereum RSI Signal Puts the Latest Rally to a Critical Test
Ethereum’s daily RSI has moved above 65, a level that repeatedly appeared shortly before local tops during the past year. The next few sessions could show whether $ETH is preparing for another pullback or finally changing its broader bearish structure.
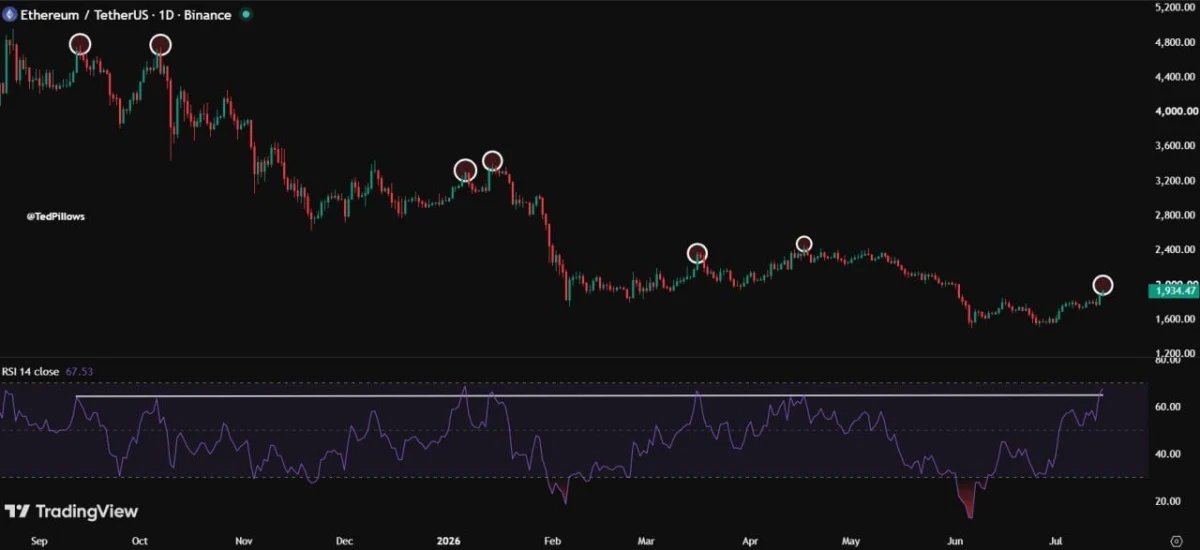
$ETH daily chart. Source: Ted/X
The chart shows several earlier cases where Ethereum peaked within two or three days after the RSI crossed above 65. Those signals appeared near declining price highs, reinforcing the pattern of weaker rallies within the wider downtrend.
Another quick rejection would suggest buyers still cannot maintain momentum once $ETH approaches overbought conditions. It would also preserve the sequence of lower highs that has controlled the market since the August 2025 peak.
However, the current move could produce a different result if $ETH consolidates instead of falling sharply. Sideways price action would allow the RSI to cool without damaging the latest recovery, which could signal that buyers are absorbing profit-taking.
A successful reset followed by another advance would offer stronger evidence of a trend reversal. Until then, the RSI reading acts as a warning that Ethereum’s latest rally has reached the same pressure point that ended several earlier rebounds.
Ethereum Nears Major Breakout Against Bitcoin
Ethereum is pressing against the upper boundary of an 11-month downtrend against Bitcoin. A confirmed breakout could mark a major shift in relative strength and improve the outlook for the wider altcoin market.
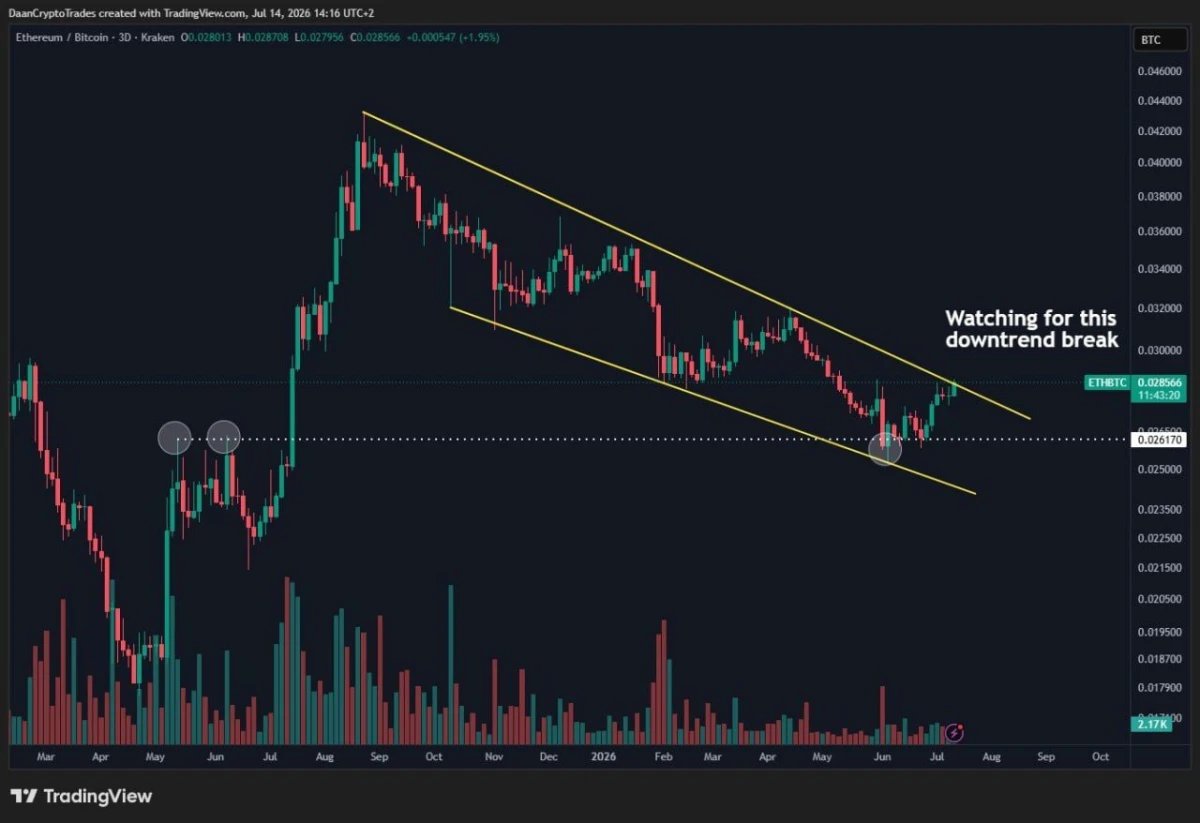
$ETH/$BTC three-day chart. Source: Daan Crypto Trades/X
The chart shows $ETH/$BTC trading inside a descending channel since its September peak. Ethereum recently bounced from the lower boundary and reclaimed the horizontal support near 0.026 $BTC, giving buyers another chance to challenge the long-term resistance line.
Price is now testing the channel’s upper boundary, where earlier recovery attempts failed. A brief move above the trendline would not confirm the breakout on its own; $ETH/$BTC needs to close above it on higher timeframes and hold the level during a retest.
A successful breakout would show that Ethereum is beginning to outperform Bitcoin after months of weakness. That shift could also support other altcoin-to-Bitcoin pairs, as capital often moves further into the market when $ETH gains relative strength.
However, another rejection would keep the descending structure intact and could return $ETH/$BTC toward 0.026 $BTC. Losing that support would weaken the recovery and raise the risk of another move toward the channel’s lower boundary.