
Ethereum is testing resistance as a TD Sequential sell signal and a broader corrective structure raise the risk of another decline. $ETH could first sweep liquidity above recent highs, but failure to hold the move may expose $1,770, $1,700 and eventually $1,505.
Ethereum Sell Signal Raises Risk of Drop Toward $1,700
Ethereum is testing the upper boundary of its price channel as the TD Sequential indicator flashes a sell signal, according to analyst Ali Charts. The overlap of technical resistance and weakening momentum increases the risk of a short-term pullback.
The channel top acts as resistance because previous advances have struggled near the same boundary. At the same time, the TD Sequential signal suggests the current upward move may be losing strength after an extended run.
The first downside level sits near $1,770, where buyers could attempt to defend the recent structure. A clear break below that support would shift attention toward $1,700, which represents the next major target in the bearish scenario.
However, the sell setup still requires confirmation through rejection and continued downside movement. A decisive breakout above the channel would invalidate the immediate correction case and suggest buyers remain in control.
Ethereum Rally Could Turn Into a Liquidity Trap
Ethereum’s rebound from the June 26 low looks impulsive on the 12-hour chart, but the wider structure leaves room for one final move lower. Analyst TraderJBx expects $ETH could first sweep liquidity above recent highs before reversing toward the equal lows near $1,505.
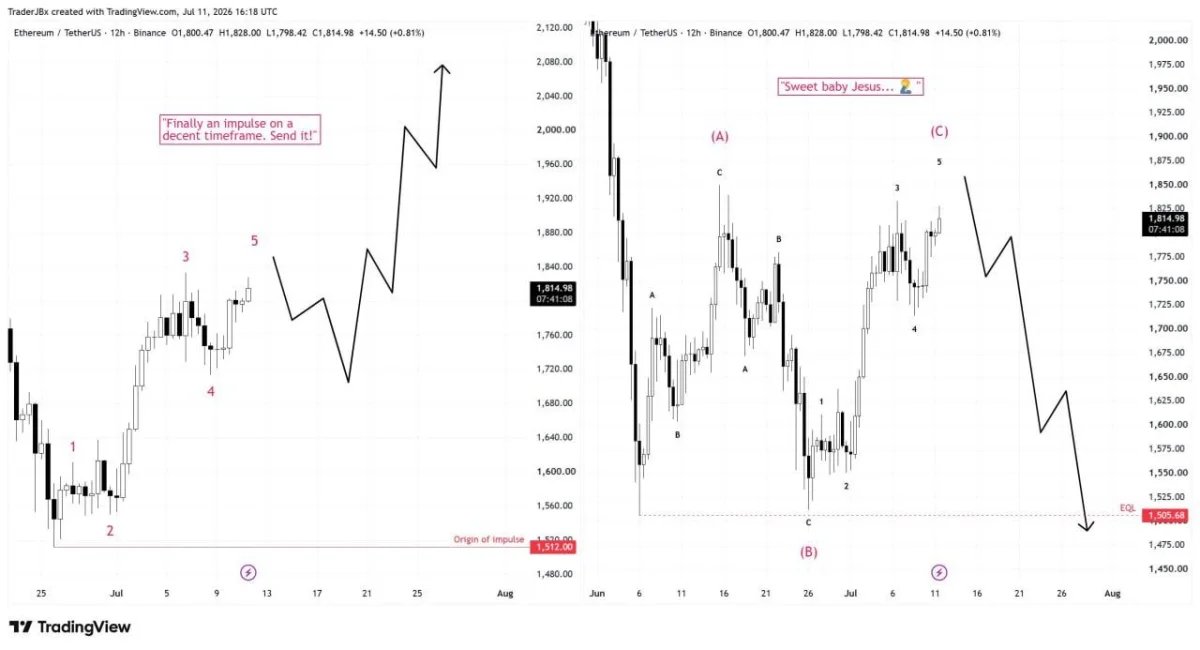
$ETH 12-hour chart. Source: TraderJBx/X
The short-term chart shows a five-wave advance from the late-June bottom, which normally supports continued upside after a pullback. Under that scenario, $ETH could retrace toward the $1,700-$1,760 region before extending above $2,000.
However, the broader chart presents a more bearish interpretation. The June 6 and June 26 lows formed near the same level, while the surrounding moves resemble corrective ABC structures, raising the possibility of an inverted flat correction.
In that case, $ETH could push above the recent $1,850 area to collect liquidity and attract late buyers before turning lower. A rejection after that sweep would put $1,750 and $1,600 back in focus, followed by the equal-lows zone near $1,505.
A sustained move above $2,000 would weaken the bearish scenario and support the case for a larger relief rally. Until then, the current advance may be a temporary liquidity move rather than the start of a confirmed uptrend.