
Ethereum price has held above $1,850 as strong spot ETF inflows countered risk-off pressure from renewed U.S.-Iran hostilities and volatile oil prices.
According to data from crypto.news, Ethereum ($ETH) traded near $1,865 at press time, down about 0.3% on the day but 4.2% higher over the past week. Market sentiment remained cautious after the token failed to retain gains from its midweek rally to $1,944, though buyers continued to defend an ascending support line formed from the June low.
A softer-than-expected U.S. inflation report initially helped $ETH reach its highest price in several weeks. June core CPI rose 2.6% from a year earlier, while futures traders assigned only a 10% probability to a Federal Reserve rate increase at its July meeting, according to Reuters.
Gains stalled as the conflict between the United States and Iran disrupted traffic through the Strait of Hormuz. Brent crude touched $91.42 before retreating below $88 after Iran’s foreign ministry left the door open to negotiations. Only four vessels passed through the strait on Sunday, down from eight a day earlier, Reuters reported.
Higher energy costs could raise inflation and keep monetary policy restrictive for longer, a setup that tends to reduce demand for cryptocurrencies and other speculative assets. The pullback in oil from its session high offered some relief, but the military conflict and shipping disruptions remain unresolved.
Ethereum price needs to clear $1,938 before challenging $2,000
Ethereum’s daily chart places the first major resistance at $1,938, a horizontal level that acted as support between February and early June. $ETH briefly approached that barrier last week but failed to close above it, leaving the former support zone in sellers’ control.
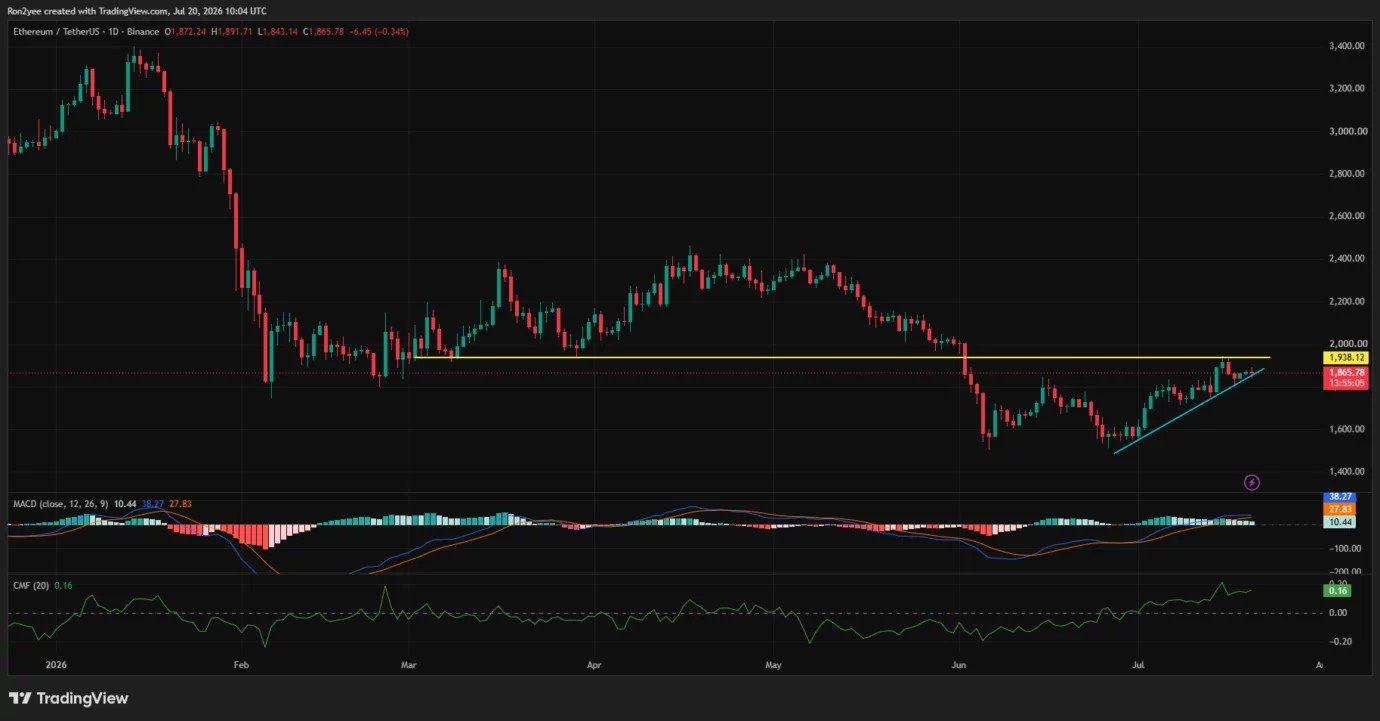
An ascending trendline drawn from the June bottom now passes through the $1,850 area. Price has tested the line several times during July without recording a daily breakdown. A close above $1,938 would complete a recovery of the lost range and open a direct path toward the psychological $2,000 level.
Momentum remains constructive on the daily timeframe. The MACD line stands at 38.27, above its 27.83 signal line, while the positive histogram reads 10.44. Chaikin Money Flow sits at 0.16, showing that net capital has continued to enter $ETH during the latest recovery.
According to analyst Ted Pillows, whale accumulation has accompanied the defense of $1,850.
“If Ethereum holds above this, a rally towards $2,000 could happen in a few weeks.”
The 4-hour chart places $ETH just above the 78.6% Fibonacci retracement at $1,853.92. Holding that level would keep $1,946.65, the top of the measured recovery range, within reach. A breakout there would also confirm a move beyond the daily resistance pocket.
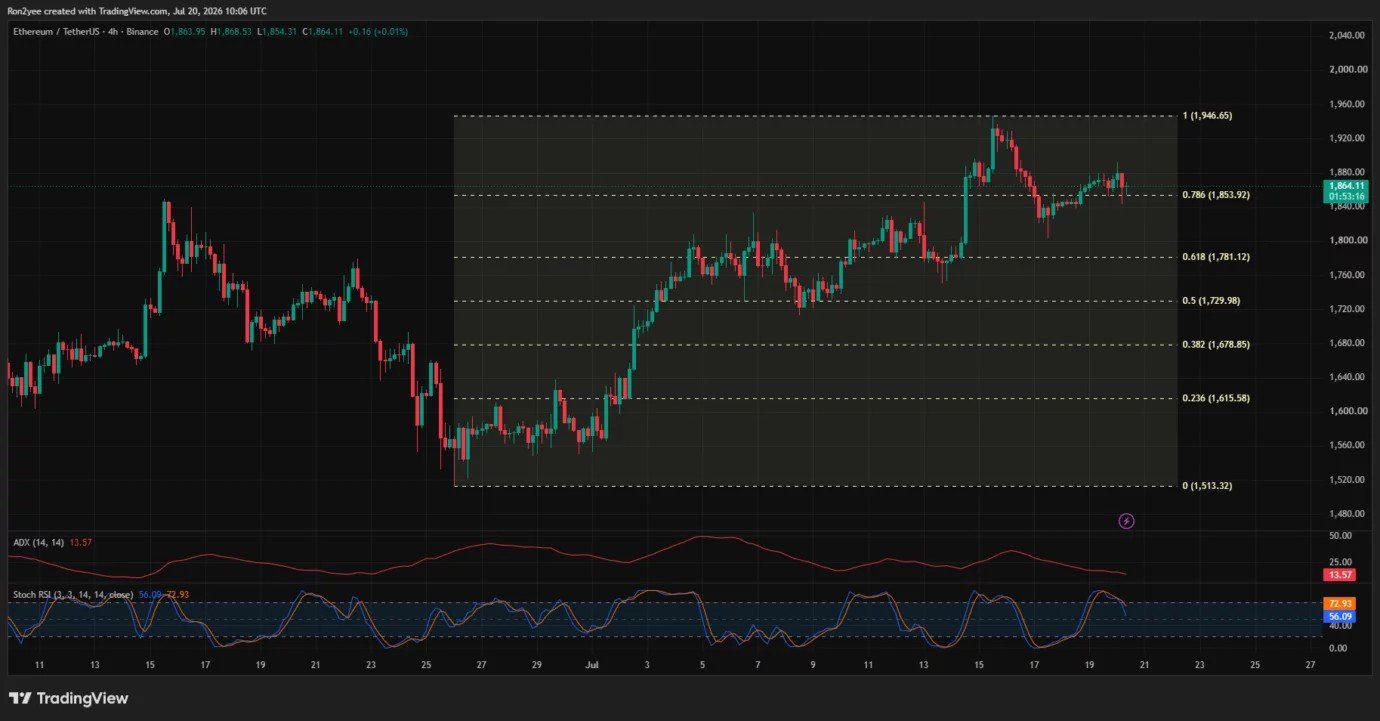
Short-term momentum carries less conviction. The 4-hour ADX has dropped to 13.57, a level associated with weak trend strength. Stochastic RSI has also turned lower, with its faster line at 56.09 below the slower line at 72.93, which leaves $ETH vulnerable to further consolidation before another breakout attempt.
Institutional flows have provided a counterweight to weak spot momentum. U.S. spot Ethereum ETFs attracted $105 million between July 13 and July 17, their strongest week since April and a second consecutive week of inflows. BlackRock’s ETHA contributed $135 million, while Fidelity’s FETH recorded a $21.56 million outflow, according to SoSoValue data.
Relative strength against Bitcoin may provide another catalyst. Trader Daan Crypto Trades identified $ETH/$BTC’s attempt to break above a descending channel that has controlled the pair for almost a year.
“If this move sustains into next week and $ETH/$BTC keeps grinding higher, that should bode well for many primarily $ETH ecosystem coins.”
Loss of $1,850 would weaken the recovery structure
Ethereum’s bullish setup would lose its immediate foundation if price closes below the ascending trendline and the $1,853 Fibonacci level. The next 4-hour support sits at $1,781, the 61.8% retracement, followed by $1,730 at the midpoint of the June-to-July advance.
A deeper decline would expose $1,679 and $1,615. The June low at $1,513 remains the full invalidation level for the recovery, as a return to that area would erase nearly all gains accumulated since late June.
CoinGlass’ Hyperliquid liquidation map shows limited leverage directly around the current price. Long-liquidation exposure starts to increase below $1,810 and becomes denser around $1,665 and $1,500, which could accelerate a breakdown if support fails.
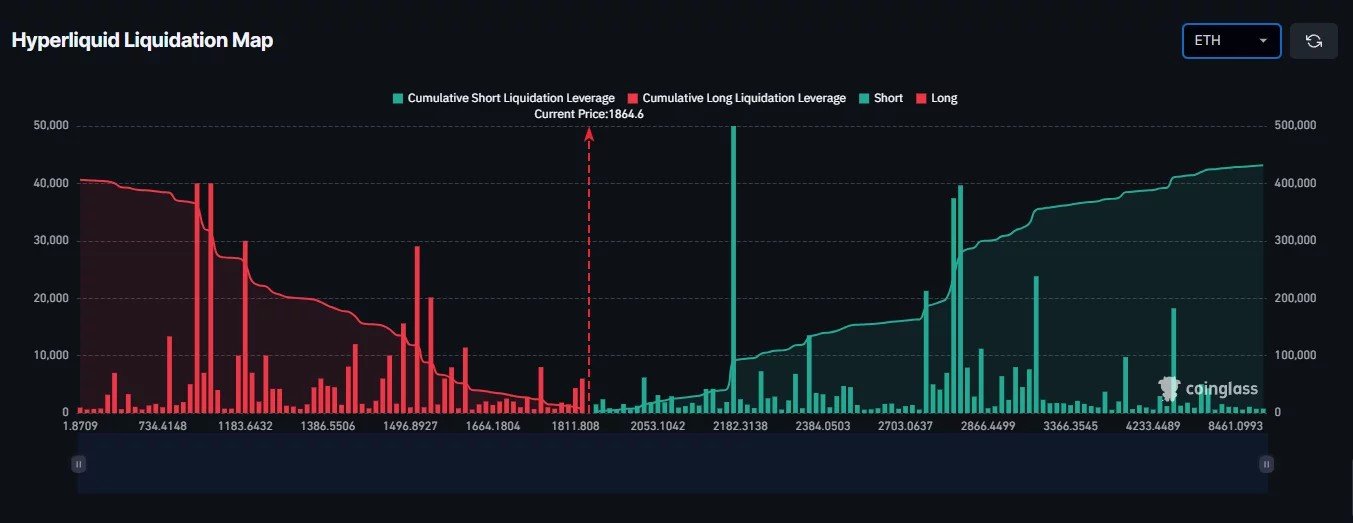
Above the market, short-liquidation leverage rises sharply near $2,180 and expands around $2,700 to $2,860. Those clusters remain distant, but a confirmed break above $2,000 could force leveraged bears to cover and add momentum to the advance.
For now, $1,850 and $1,938 define Ethereum’s decision range. ETF inflows, positive daily capital flow and an improving $ETH/$BTC pair support another test of $2,000, while weak 4-hour trend strength, elevated oil prices and unresolved geopolitical risks leave the breakout dependent on a clean daily close above resistance.