
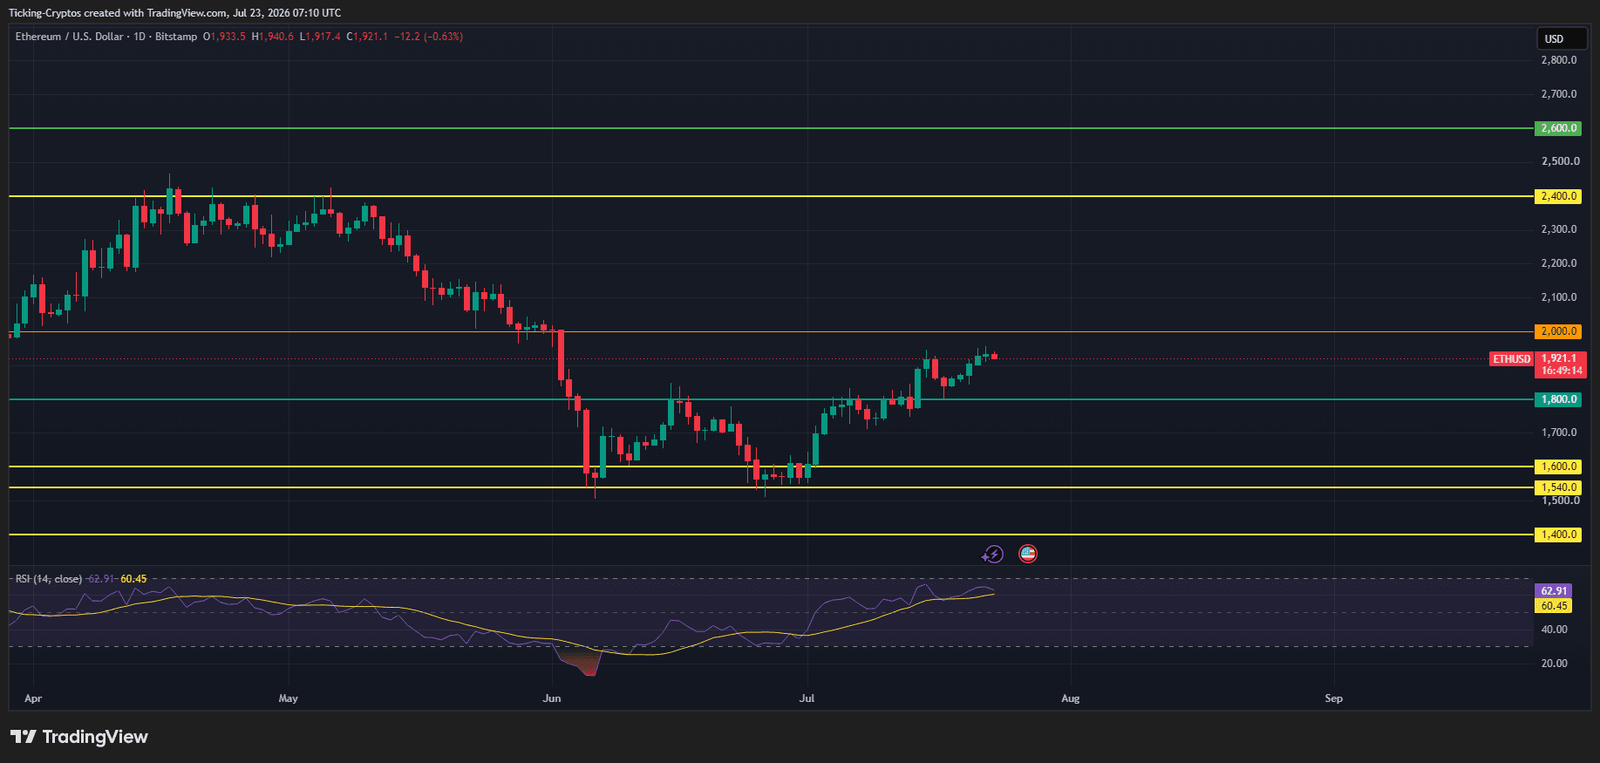
Ethereum is knocking on the door of $2,000. After bottoming near $1,500 in June, $ETH has staged one of its most constructive recoveries of the year, climbing steadily through July to trade at $1,921 at the time of writing. The chart shows a clean sequence of higher lows, and the daily RSI at roughly 60 and rising confirms that momentum has swung firmly back to buyers. The question now is whether $ETH can convert this momentum into a breakout above the psychologically loaded $2,000 mark.
Where does Ethereum trade right now?
$ETH is changing hands around $1,921, down a marginal 0.63% on the day but comfortably inside its July uptrend. The recovery has been orderly rather than explosive: price reclaimed the $1,800 zone and has been holding above it, turning former resistance into fresh support. The 4H structure reveals a clear and steady uptrend throughout July — a series of higher lows building from $1,450 through $1,600, $1,700, $1,800, and now approaching $1,900 — the most constructive price structure $ETH has shown all year. That structural shift is what separates the current move from the failed bounces earlier in 2026.
What are the key resistance levels for $ETH?
The immediate battle is at $2,000 (marked orange on the chart). This is both a psychological round number and a technical ceiling where prior selling clustered. Above it, the next major hurdle sits at $2,400 (yellow), the level that capped $ETH throughout April and May, followed by the green line at $2,600. A daily close above $2,000 would open the path toward that $2,400 zone; until then, $ETH remains in a recovery phase rather than a confirmed breakout. Broader forecasts echo this: longer-term forecasts can still point above $2,000–$2,500 by year-end, but that now depends on ETF stabilization, stronger liquidity, and renewed risk appetite.
What are the downside support levels?
On the way down, $1,800 is the first line of defense — the level $ETH just reclaimed and must now hold to keep the bullish structure intact. Below that, support steps down to $1,600, then $1,540, and finally $1,400 (all marked yellow), which roughly aligns with June's capitulation lows. Losing $1,800 on a daily close would be the first warning that the July recovery is unwinding.
Ethereum price prediction: high and low targets
Putting the chart together with current momentum, here's how the near-term scenarios break down.
- Bullish target (high): A confirmed daily close above $2,000 clears the way toward $2,400, with the RSI still having room before overbought territory. This is the higher-probability path while $ETH holds above $1,800.
- Bearish target (low): A rejection at $2,000 followed by a break of $1,800 support puts $1,600 and then $1,540 back in play. A deeper flush would retest the $1,400 zone.
Analyst forecasts broadly align with the upside case. Ethereum's July 2026 price prediction targets $1,960, with a range of $1,718–$1,960, while some models see momentum extending into August. It's worth noting that the monthly close carries outsized weight here: if $ETH closes July above $2,050, some traders are targeting $4,000 and above, along with a new all-time high this cycle.