
Ethereum price has climbed nearly 2% to $1,942 after a rebound in semiconductor stocks and hopes for renewed US-Iran talks restored demand for risk assets.
The move took Ethereum ($ETH) price to an intraday high of $1,953 on Tuesday, extending its recovery from a July 18 low near $1,830.
Market sentiment improved as Asian technology shares recovered from their recent AI-driven selloff, with South Korea’s Kospi gaining 3.6%, Japan’s Nikkei rising 3%, and Taiwan’s Taiex adding 4.2%, according to the Associated Press.
Samsung Electronics, SK Hynix, and Taiwan Semiconductor led the rebound after chip stocks suffered heavy losses in the previous session. Ethereum followed the sector higher because traders returned to high-beta assets following the technology-led market shock.
Oil prices also eased as regional mediators pushed Washington and Tehran to consider a proposed 10-day ceasefire. West Texas Intermediate crude fell toward $82 per barrel, while Brent dropped 1.4% to $88.01. Lower energy prices reduced immediate fears that another inflation shock could keep central banks restrictive for longer.
Diplomatic progress remains uncertain. US Central Command carried out another round of strikes against Iranian command centers, missile sites, maritime assets, and air defenses on Monday evening. Iran subsequently attacked a tanker in the Strait of Hormuz, while Yemen’s Iran-backed Houthis declared a maritime embargo against Saudi Arabia.
CENTCOM reported that commercial traffic through the Strait of Hormuz continued despite the fighting. The command said its forces had helped around 900 vessels carrying 450 million barrels of crude pass through the waterway since early May.
ETF inflows and whale purchases have strengthened Ethereum demand
US spot Ethereum exchange-traded funds recorded $38.09 million in net inflows on July 20, according to SoSoValue data. BlackRock’s ETHA accounted for $34.3 million, while Fidelity’s FETH drew another $2.83 million. The products held almost $10 billion in net assets, equal to about 4.5% of Ethereum’s market capitalization.
Wallet-tracking platform Lookonchain also reported several large $ETH purchases on Monday. One whale returned after three months of inactivity and spent 20 million USDC to acquire 10,501 $ETH at an average price of $1,905.
Whales continue to accumulate $ETH.
— Lookonchain (@lookonchain) July 21, 2026
New wallet (0xf23c) just withdrew another 7,000 $ETH($13.46M) from #Binance and staked it.https://t.co/aLVOOm0j23 pic.twitter.com/WRhJCVWlt7
A newly created wallet separately withdrew 12,800 $ETH, worth $24.47 million, from Binance within 24 hours and staked the entire amount. Lookonchain later identified another 7,000 $ETH withdrawal, valued at $13.46 million, from the exchange into the same wallet.
Combined, the two withdrawals removed 19,800 $ETH worth about $38 million from Binance. Exchange withdrawals do not guarantee long-term holding, but the subsequent staking transactions reduced the amount immediately available for sale.
Ethereum price faces a decisive test between $1,950 and $2,000
Ethereum’s 4-hour chart shows an ascending parallel channel that has guided price higher since late June. $ETH now trades near the channel’s upper half and directly below the $1,952 Fibonacci resistance, drawn from the June low of $1,513.
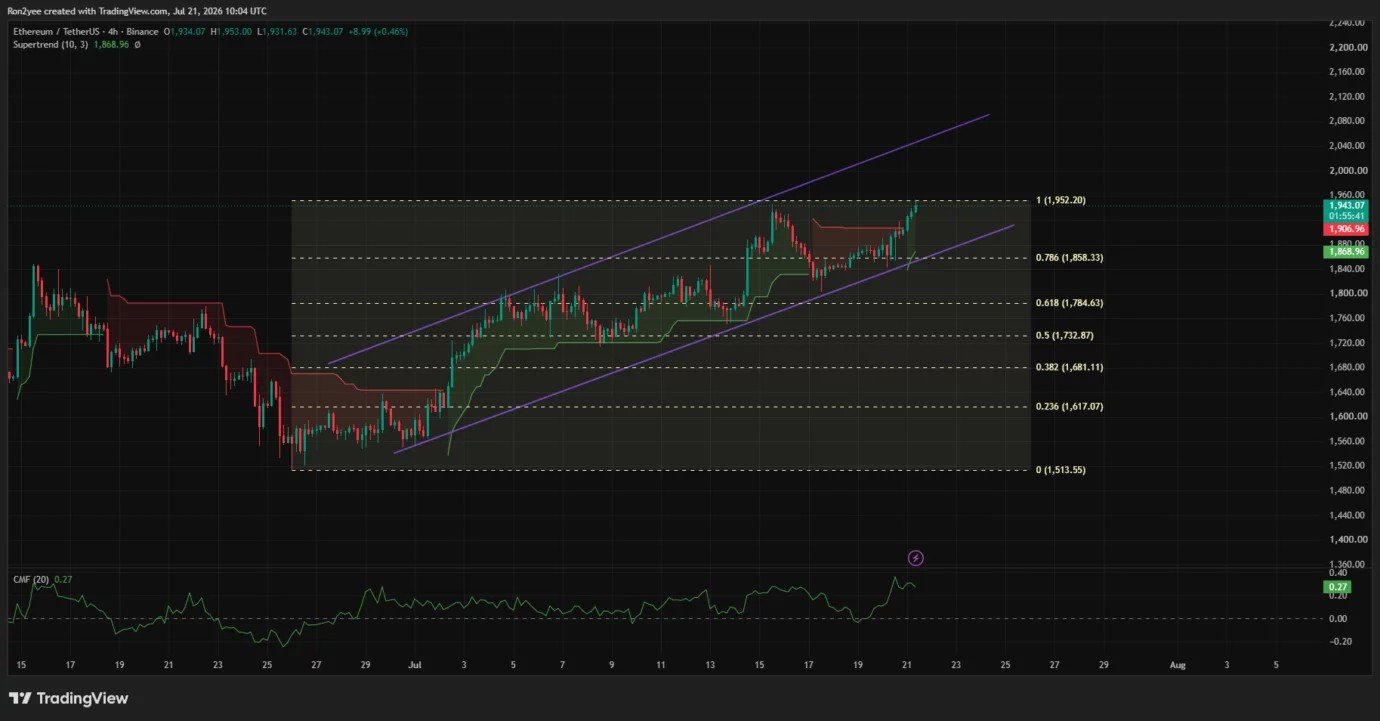
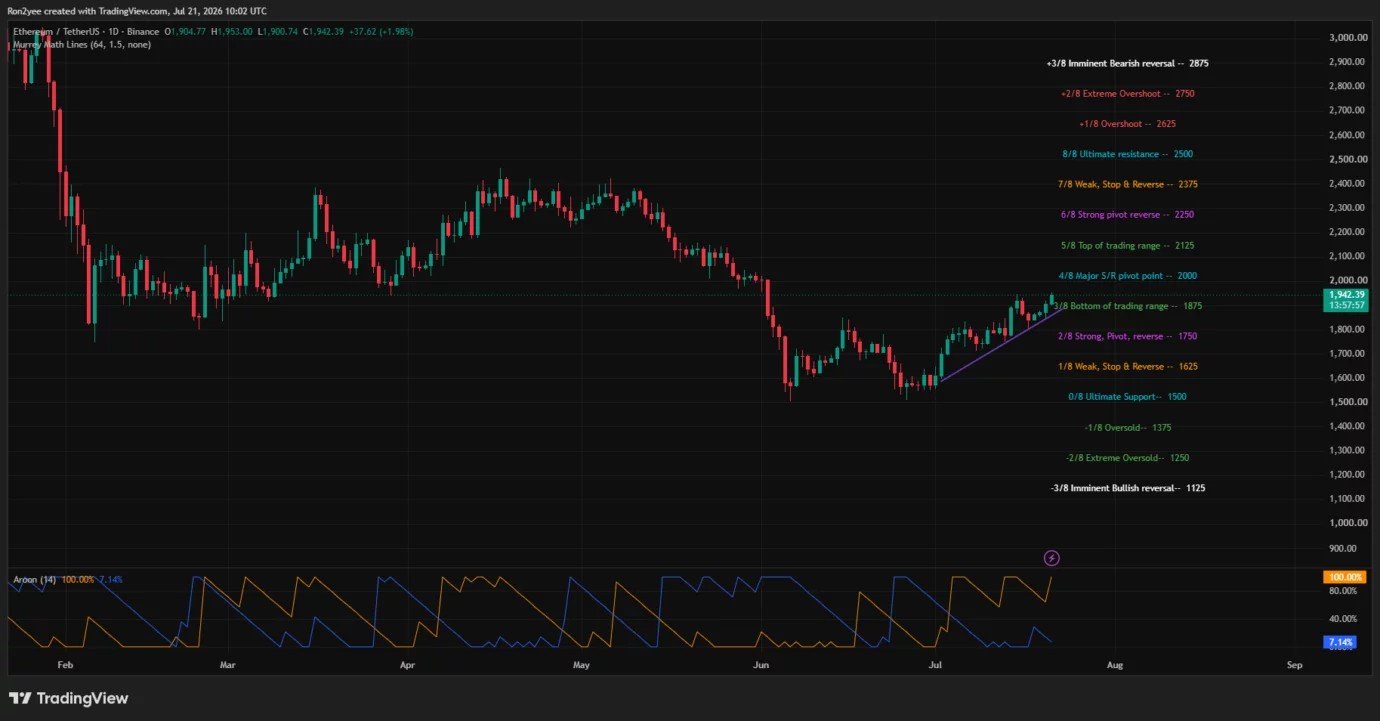
A confirmed 4-hour close above $1,952 would expose the psychological $2,000 level. The daily chart places $2,000 at a major Murrey Math support-and-resistance pivot, while the next channel objective sits near $2,080.
Analyst Ted Pillows identified the same threshold as the key breakout point, noting:
“$ETH is moving towards the $2,000 level. This is a major resistance zone for Ethereum, and a reclaim could result in another leg up.”
The 4-hour Supertrend has flipped bullish and now sits at $1,869, below the 78.6% Fibonacci retracement at $1,858. Cash flow has strengthened alongside the advance, with the Chaikin Money Flow reading at 0.27. A positive CMF value shows that buying volume has exceeded selling volume during the current move.
On the daily chart, Aroon Up has reached 100%, while Aroon Down has fallen to 7.14%. The gap shows that $ETH recently set a strong period high and has not revisited a major low. Price has also stayed above a rising trendline drawn from the late-June bottom, preserving the sequence of higher lows.
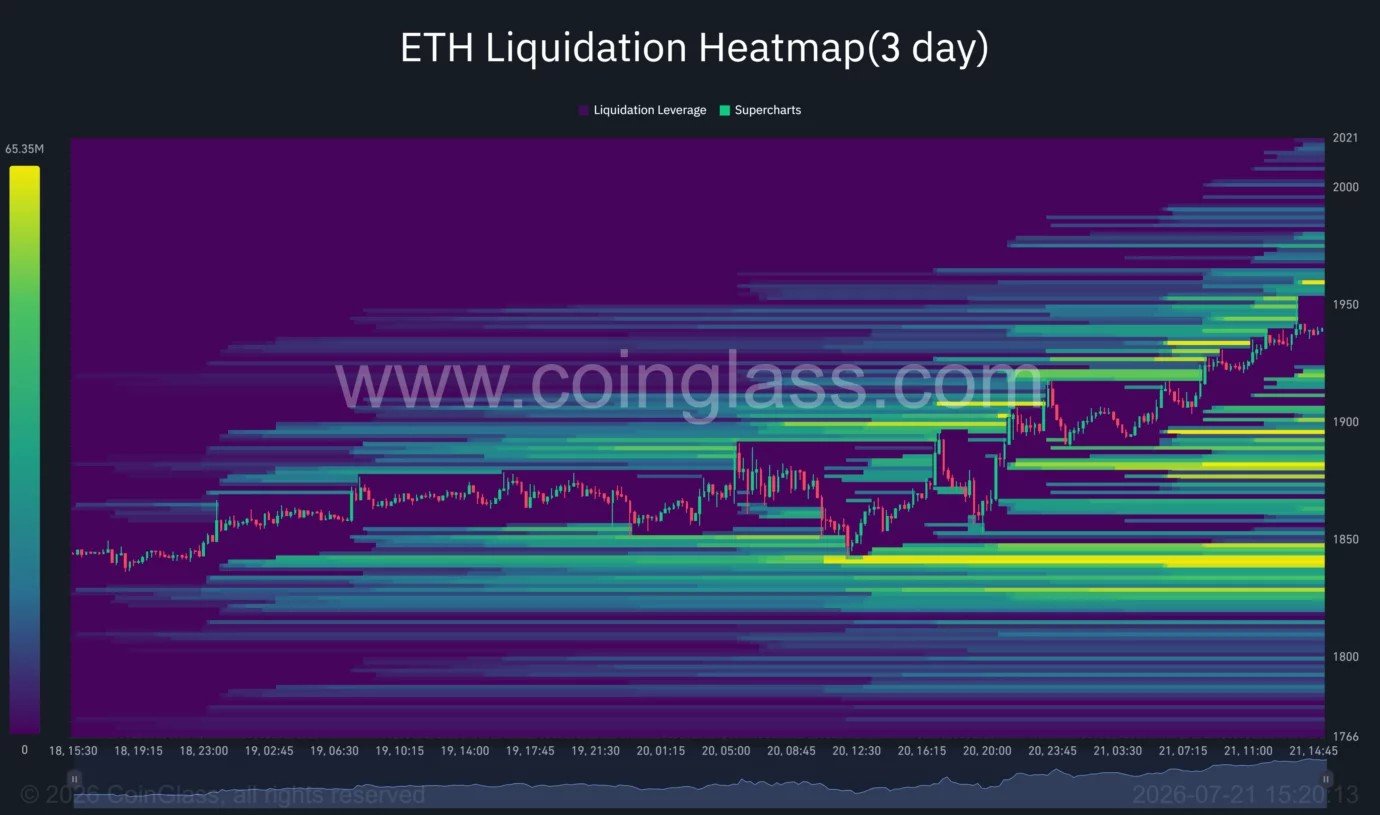
CoinGlass’s three-day liquidation heatmap shows concentrated short leverage between $1,950 and $1,970. A move through that band could force short liquidations and accelerate a test of $2,000. Additional liquidity rests above $2,000 and near $2,020.
Downside risk would increase if $ETH fails at $1,952 and loses the $1,907 short-term support. The next defenses sit at the Supertrend level of $1,869 and the $1,858 Fibonacci zone.
Crypto trader Daan Crypto Trades identified $1,750 as the larger structural invalidation level because it served as February’s low and a major reversal area in 2025. A daily close below that support would break the rising trendline and expose $1,625, followed by the June low near $1,513.
$ETH $1750 remains the key area to hold for the bulls.
— Daan Crypto Trades (@DaanCrypto) July 20, 2026
This marked the February low but also marked the higher low & market structure shift back in 2025 before the large rally.
Above, $2.1K is the main resistance to watch. https://t.co/PAHmyFsitT pic.twitter.com/RVgmf5tMEh
Renewed attacks around the Strait of Hormuz could also reverse the oil decline and revive inflation concerns. Until $ETH clears $2,000, geopolitical escalation and concentrated resistance leave the recovery vulnerable to another pullback.