
As of August 25, 2026, the Ethereum price is trading around $2,510, holding just below daily resistance after a sharp advance pushed momentum readings into overbought territory. Bitcoin topping $80,000 and a Fear & Greed Index of 74 confirm the broad risk appetite driving the move.
Key takeaways
- $ETH trades near $2,510 with a daily RSI of 80.39, deep in overbought territory that markets rarely sustain for long.
- Bitcoin’s surge past $80,000 and a Fear & Greed Index of 74 are fueling broad risk appetite across the crypto market.
- Uniswap V3 fees surged 191.9% over seven days, signaling genuine on-chain demand rather than purely speculative activity.
- A daily ATR of 104.49 warns of elevated volatility across all timeframes in the sessions ahead.
- The 15-minute MACD has flipped slightly negative, hinting at short-term exhaustion despite the intact uptrend.
The dominant force right now is momentum, not mean reversion — at least not yet. Ethereum has rallied hard enough to stretch well above its own daily moving averages. The broader market cap figure of roughly $2.73 trillion, up 1.94% in 24 hours, confirms this is not an $ETH-only story. Bitcoin dominance sitting at 59.27% tells you $BTC is still leading the parade, but $ETH is clearly riding the same wave of risk appetite.
Daily Chart: A Trend Running Hot
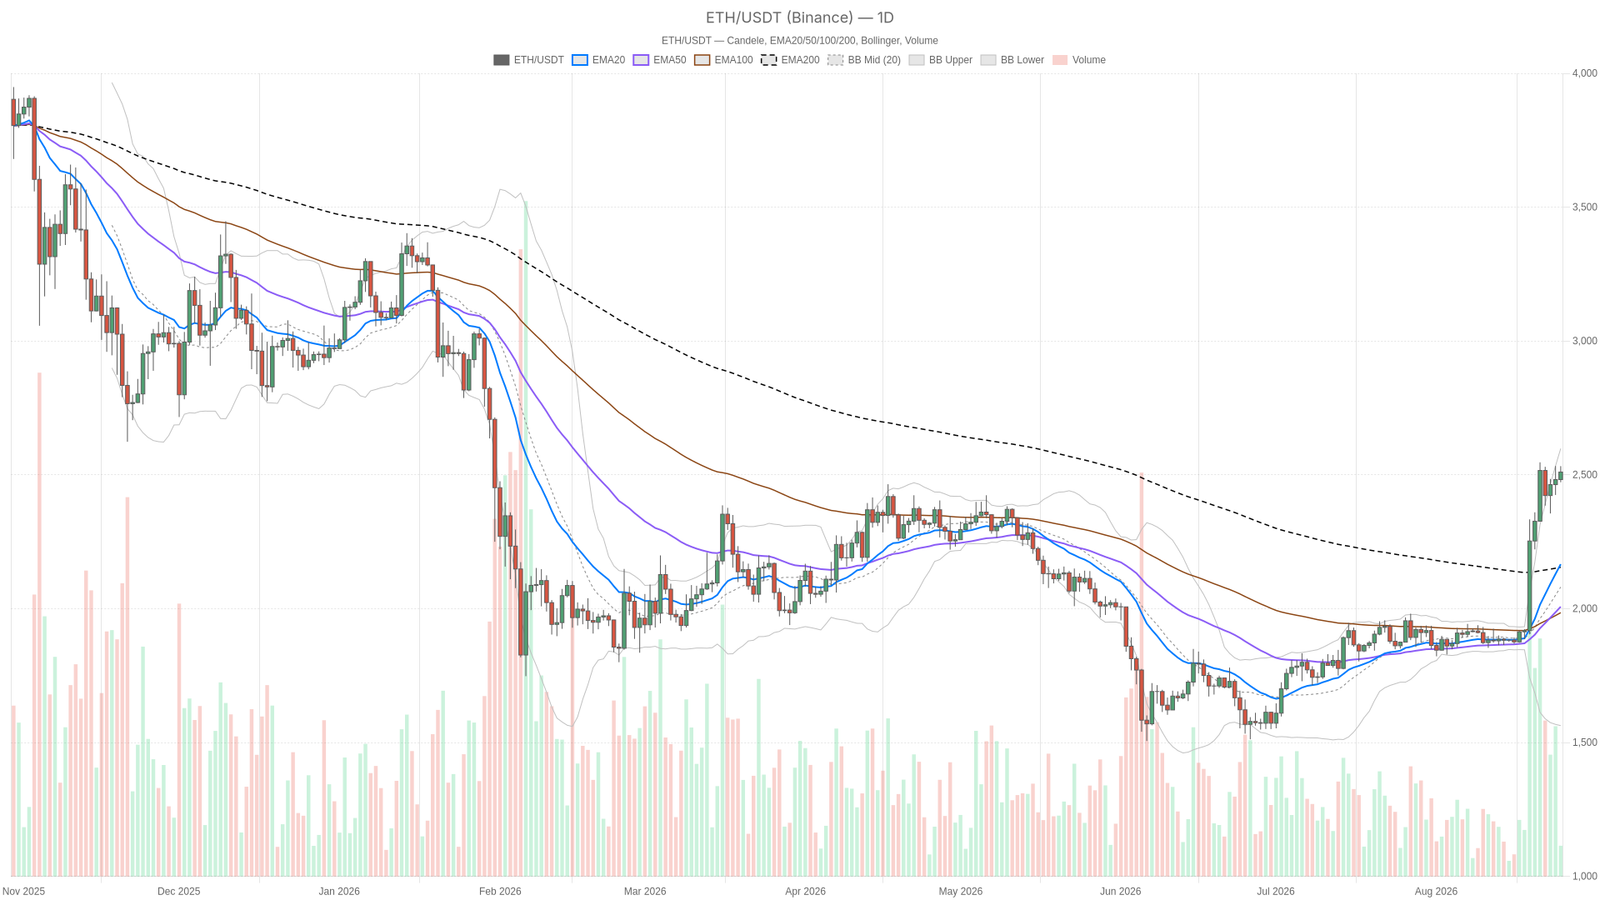
On the daily timeframe, price at $2,510.47 sits above the EMA20 (2,166.13) and EMA50 (2,007.28), though the EMA50 sits below the EMA200 (2,154.65), so the moving average alignment is not a clean bullish stack. That said, the system’s own regime tag reads neutral here, a useful reminder that raw trend classification can lag what the indicators are actually screaming. RSI14 at 80.39 is deep into overbought territory — the kind of reading that typically precedes either a continuation blow-off or a sharp cooling-off period.
MACD is still expanding, with the line at 162.11 well above the signal at 103.83 and a histogram of 58.28, so momentum has not rolled over yet, even if it is stretched. The Bollinger Bands add more context: price is trading well above the mid-band (2,080.72) and closing in on the upper band (2,598.31), while the lower band sits far below at 1,563.13. Moreover, being this close to the upper boundary while RSI is this hot usually means volatility is about to pick up in one direction or the other. The daily pivot at 2,505.05, with resistance at 2,537.92 (R1) and support at 2,477.60 (S1), gives a fairly tight decision zone for the next session.
Hourly Structure: Bullish but Losing Steam
The 1H chart is tagged bullish, and the EMA alignment supports that. Price at 2,510 sits above EMA20 (2,485.65), EMA50 (2,462.37), and EMA200 (2,285.76). However, there is a subtle warning sign: RSI14 has cooled to 61.34 from the daily extreme reading, and the MACD histogram has shrunk to just 0.94, with the line (11.75) barely above the signal (10.81). That is a market still technically in an uptrend but running out of thrust on the hourly clock. The Bollinger Bands are notably tight, with the upper at 2,518.79 and the lower at 2,459.15, which often precedes a volatility expansion. Hourly pivot levels frame a narrow battle zone that will likely decide the next directional push.
15-Minute Execution: Early Signs of Local Exhaustion
Zooming into the 15-minute chart, the regime is still labeled bullish, and price at 2,510 remains above EMA20 (2,499.40), EMA50 (2,491.88), and EMA200 (2,470.98). But the MACD histogram has flipped slightly negative at -0.23, with the line (4.19) just dipping below the signal (4.42). This minor bearish cross suggests short-term buyers are pausing rather than pushing. RSI14 at 59.17 is not alarming, but combined with the MACD flip it points to consolidation rather than acceleration at this exact moment. The tight Bollinger range and the compressed pivot structure confirm this is a market catching its breath, not reversing outright.
Market Backdrop: Greed, Broad Strength, and On-Chain Demand
The macro picture matters here. A Fear & Greed Index of 74 signals that sentiment is running hot across the board, which lines up neatly with the overbought daily RSI on Ethereum. Bitcoin’s push past $80,000, as reported by CNBC, is pulling capital and attention across the entire market. Total crypto market cap stands near $2.73 trillion, up 1.94% on the day, while Bitcoin dominance at 59.27% confirms $BTC is still driving the bus.
On the fundamentals side, DeFi activity built on Ethereum is showing real strength. Uniswap V3 fees are up 191.9% over seven days and 477.98% over thirty days, while Uniswap V4 fees have climbed 85.63% weekly and 146.69% monthly. Fluid DEX has also seen fees jump 124.04% over the past week. Curve DEX, however, is the outlier, with fees down 64.87% over seven days. Still, the aggregate picture points to genuine on-chain demand backing the Ethereum price, rather than just speculative froth.
Bullish Scenario
If $ETH holds above the daily pivot at 2,505.05 and the hourly support at 2,498.57, the path of least resistance points toward the daily R1 at 2,537.92. The upper Bollinger Band near 2,598.31 serves as a stretch target. This scenario is supported by the still-expanding daily MACD and the fully bullish EMA stack across both daily and hourly charts.
The broader risk-on tone from Bitcoin’s break above $80,000 adds further weight. Sustained DeFi fee growth on Ethereum-based protocols like Uniswap provides a fundamental leg to the technical case. However, this view would be invalidated by a clean daily close back below the 2,505 pivot, accompanied by the hourly MACD histogram flipping negative. That combination would suggest the overbought condition is being resolved through selling rather than a pause.
Bearish / Mean-Reversion Scenario
The counter-argument centers on that daily RSI of 80.39 — a level that historically does not hold for long without at least a partial pullback. The 15-minute MACD has already flipped slightly negative, and hourly momentum, with the histogram at just 0.94, is decelerating even as price grinds higher. If the market loses the 15-minute support at 2,507.43 and then the hourly support at 2,498.57, a retreat becomes realistic.
A move toward the daily S1 at 2,477.60 is plausible, especially given a daily ATR of 104.49 that shows this market can cover that distance in a single session. This bearish case would be invalidated if price instead pushes through daily R1 at 2,537.92 with RSI staying elevated and MACD continuing to expand. That outcome would confirm the overbought reading reflects genuine trend strength rather than exhaustion.
Positioning and Risk
Right now the timeframes are telling a layered story rather than a unified one. The daily chart shows a powerful trend that is statistically overextended. The hourly chart confirms the uptrend but with fading thrust, and the 15-minute chart hints at a short pause. That is not a contradiction so much as a normal sequence of a strong move losing speed before either resuming or correcting.
Given ATR readings of 104.49 on the daily, 21.97 on the hourly, and 12.41 on the 15-minute chart, anyone tracking this market should expect real volatility in the sessions ahead. Sentiment sitting in Greed territory alongside an extreme daily RSI can precede either a continuation rally or a sharper-than-expected pullback. The charts do not offer a clean verdict either way. The sensible approach is to watch how price behaves around the daily pivot and the hourly support zone in the next few sessions — that reaction will likely do more to clarify direction than any single indicator in isolation.
FAQ
What does Ethereum’s current RSI signal?
Ethereum’s daily RSI stands at 80.39, deep in overbought territory. Readings this elevated rarely persist for long without either a continuation blow-off or a sharp cooling-off period. However, the hourly RSI has already cooled to 61.34, while the 15-minute RSI sits at 59.17, suggesting short-term momentum is decelerating.
How is Bitcoin’s breakout influencing $ETH?
Bitcoin’s push past $80,000, as reported by CNBC on August 25, 2026, is fueling broad risk appetite across the crypto market. With total crypto market cap near $2.73 trillion and Bitcoin dominance at 59.27%, $ETH is riding the same wave of bullish sentiment, as reflected in the Fear & Greed Index reading of 74 squarely in Greed territory.
What are the key levels to watch?
The daily pivot at 2,505.05 is the immediate decision zone. Resistance lies at R1 (2,537.92) with the upper Bollinger Band near 2,598.31 as a stretch target. Support sits at S1 (2,477.60), while the hourly support at 2,498.57 serves as the first line of defense intraday. A close below 2,505 would weaken the bullish case considerably.
Is on-chain activity backing the current rally?
Yes, DeFi fee data shows genuine demand underpinning the move. Uniswap V3 fees surged 191.9% weekly and 477.98% monthly, while Fluid DEX fees jumped 124.04% over the past week. That said, Curve DEX fees fell 64.87% over seven days, indicating not all sectors are participating uniformly in the uptrend.
Disclaimer: This article is for informational purposes only and does not constitute financial advice, an investment recommendation, or a solicitation to buy or sell any financial instrument or cryptocurrency. The analysis provided is not indicative of future results. Investing in crypto assets and financial markets carries a high risk of capital loss. Always do your own research (DYOR) and consult a qualified financial advisor before making any decision.
Article produced with the assistance of artificial intelligence and reviewed by the editorial team.