
Ethereum price traded near $2,300 on Thursday after a derivatives-driven breakout pushed $ETH above its three-month range, though overbought signals now raise the risk of a pullback.
Ethereum price action today
According to data from crypto.news, Ethereum ($ETH) price traded at about $2,285 at press time on Aug. 20, up 1.4% on the daily candle after briefly reaching $2,298.
The latest advance extended a breakout that began Wednesday, when $ETH surged from below $1,950 and cleared several resistance levels in a matter of hours. At its highest point, the move represented a gain of roughly 20%.
Before the rally, Ethereum had spent most of August between $1,850 and $1,950. Repeated attempts to break above the upper end of that range failed, allowing short positions to build around the psychological $2,000 level.
A sudden increase in spot and derivatives buying changed that structure. $ETH moved through $2,000, $2,100, and $2,200 with few sustained pauses, forcing traders with bearish leveraged positions to buy back the asset as prices rose.
The initial rally produced a long upper wick near $2,330, showing that some holders took profits above $2,300. Buyers nevertheless kept $ETH above $2,250 through Thursday, preventing a deeper reversal during the first consolidation period.
What is driving the Ethereum rally?
The breakout coincided with a wider cryptocurrency rally after the U.S. Treasury announced an increase in its long-dated bond buyback operations.
On Aug. 19, the Treasury said it would raise the maximum size of liquidity-support buybacks for 10-to-30-year nominal coupon securities from $2 billion to at least $4 billion per operation. The change will take effect on Sept. 9 and remain in place through Nov. 4, according to the official announcement.
The program is intended to support liquidity in older Treasury securities rather than provide direct stimulus to cryptocurrency markets. However, some market participants interpreted the larger purchases as supportive of financial liquidity and risk assets.
MarketWatch linked the crypto rally to the announcement as longer-term Treasury yields declined. Ethereum reached its highest price since May while Bitcoin moved above $70,000 during the same risk-on move.
Derivatives positioning then added momentum. Notably, Ethereum saw $2.55 billion in taker buy volume during one hour, while a wave of short liquidations forced additional buying into a rapidly rising market.
Reported liquidations included a roughly $49 million position held by one highly ranked trader. Forced closures can accelerate a rally because exchanges automatically buy the underlying asset or close bearish contracts when collateral falls below required levels.
U.S. spot Ethereum ETFs also recorded $189.1 million in daily net inflows on Aug. 19, according to SoSoValue data. Positive ETF flows offered evidence of demand through regulated U.S. products alongside the faster derivatives move.
Political developments added to the broader improvement in crypto sentiment. President Donald Trump called on Congress to advance federal digital asset market structure legislation following an Aug. 19 White House event attended by executives from several crypto companies.
The Securities and Exchange Commission has also proposed a framework covering certain registered crypto asset offerings. Both developments may affect the long-term regulatory outlook, although neither represents a completed change to federal law.
Ethereum faces resistance between $2,300 and $2,500
Ethereum’s daily chart shows a clear break above the Ichimoku cloud and its main trend lines. $ETH traded about 9% above the Tenkan-sen at $2,098 and 10% above the Kijun-sen near $2,078, reflecting the speed of the move.
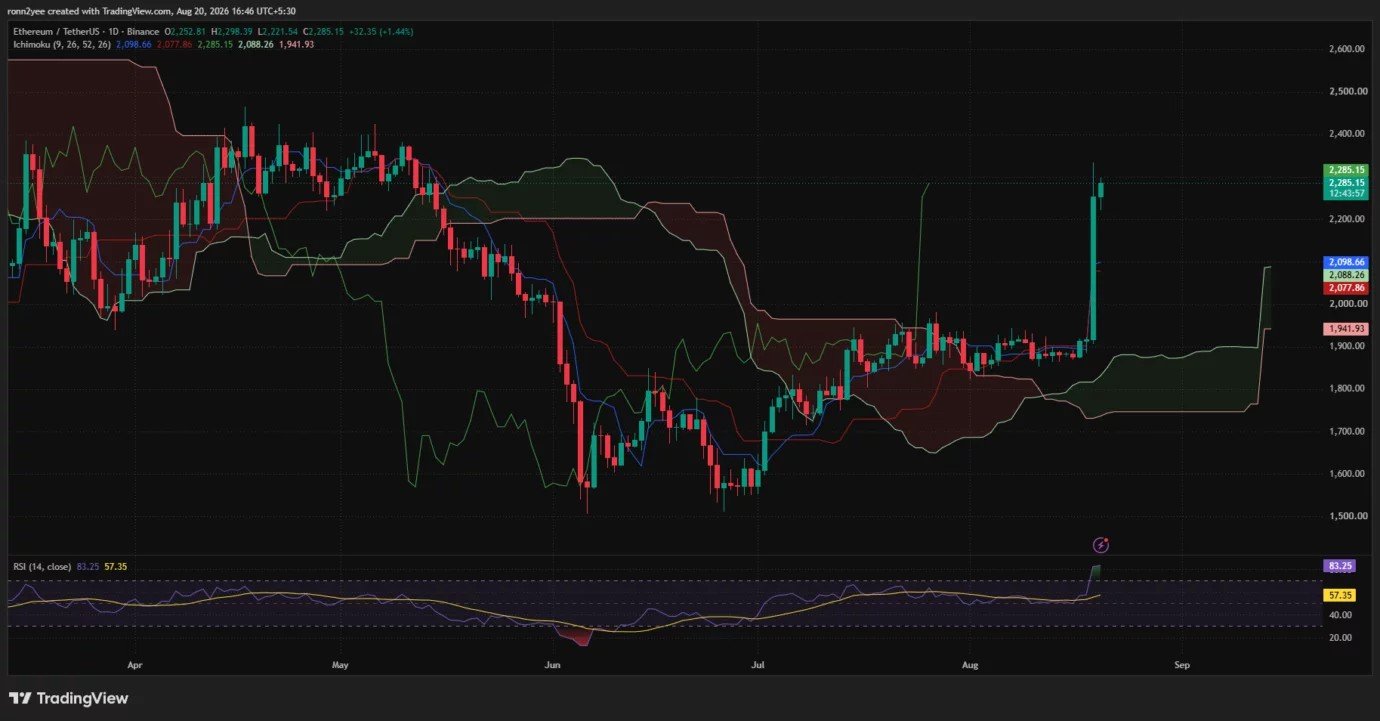
The cloud’s upper boundary sits around $2,088, making the $2,075–$2,100 area an important support region if $ETH gives back part of its rally. Holding that zone would preserve the broader breakout even if the price retreats from $2,300.
The nearest support on shorter time frames sits between $2,220 and $2,250, where buyers repeatedly entered after the initial spike. A break below that area could expose $2,100, followed by the former range ceiling around $1,950–$2,000.
Momentum has become stretched, however. The daily relative strength index reached 83.25, well above the conventional overbought threshold of 70 and its moving average near 57.
An overbought RSI does not guarantee an immediate decline, particularly during a strong breakout. It does show that $ETH has risen much faster than its recent average and may require consolidation before making another sustained move.
The 4-hour Bollinger Bands tell a similar story. Ethereum traded near $2,288, slightly above the upper band at about $2,283, while the middle band remained near $1,998. The wide distance between the price and the middle band shows how far $ETH has moved from its recent mean.
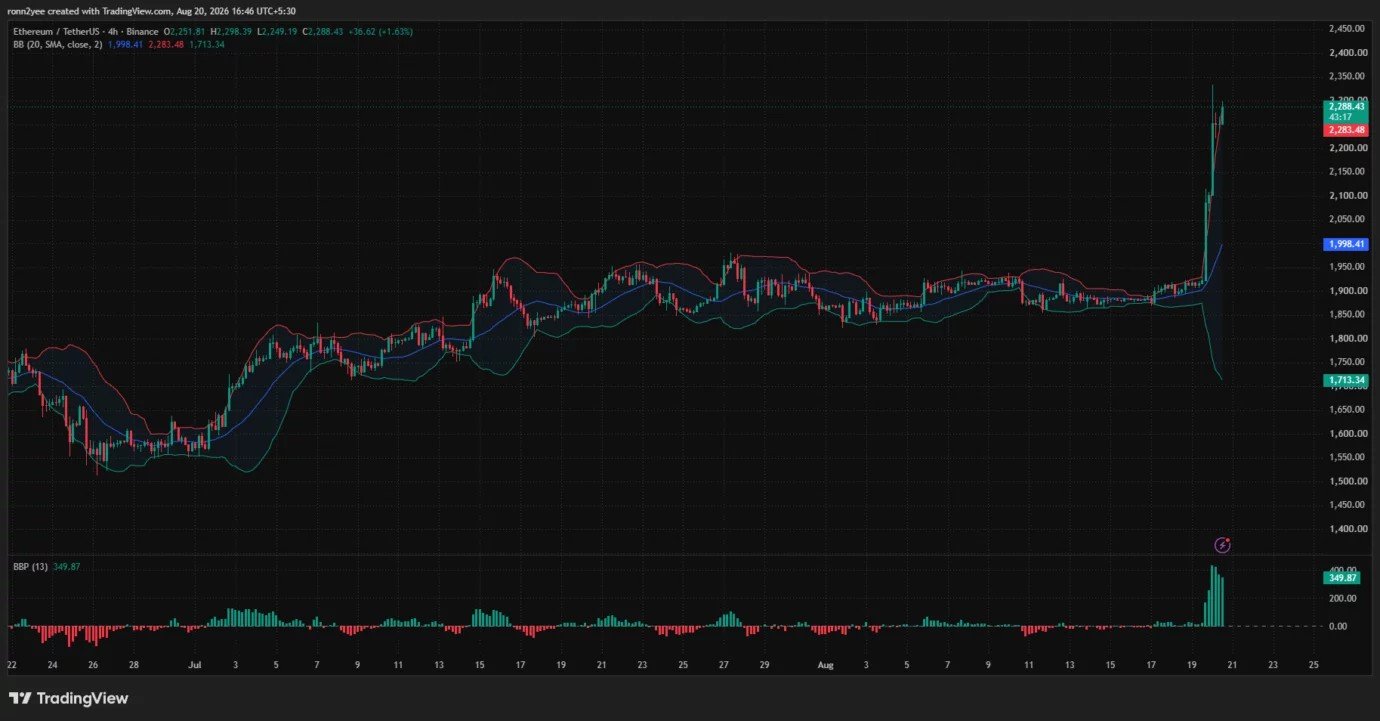
A daily close above $2,300 would open the path toward $2,400 and then $2,500. The latter level carries added importance because it sits near longer-term moving averages and a previous supply region visible on the weekly chart.
Liquidation map raises volatility risk near $2,300
The three-day CoinGlass liquidation heatmap shows $ETH approaching a series of leveraged positions between $2,300 and $2,350. A move into that zone could trigger further short closures, providing fuel for another brief extension.
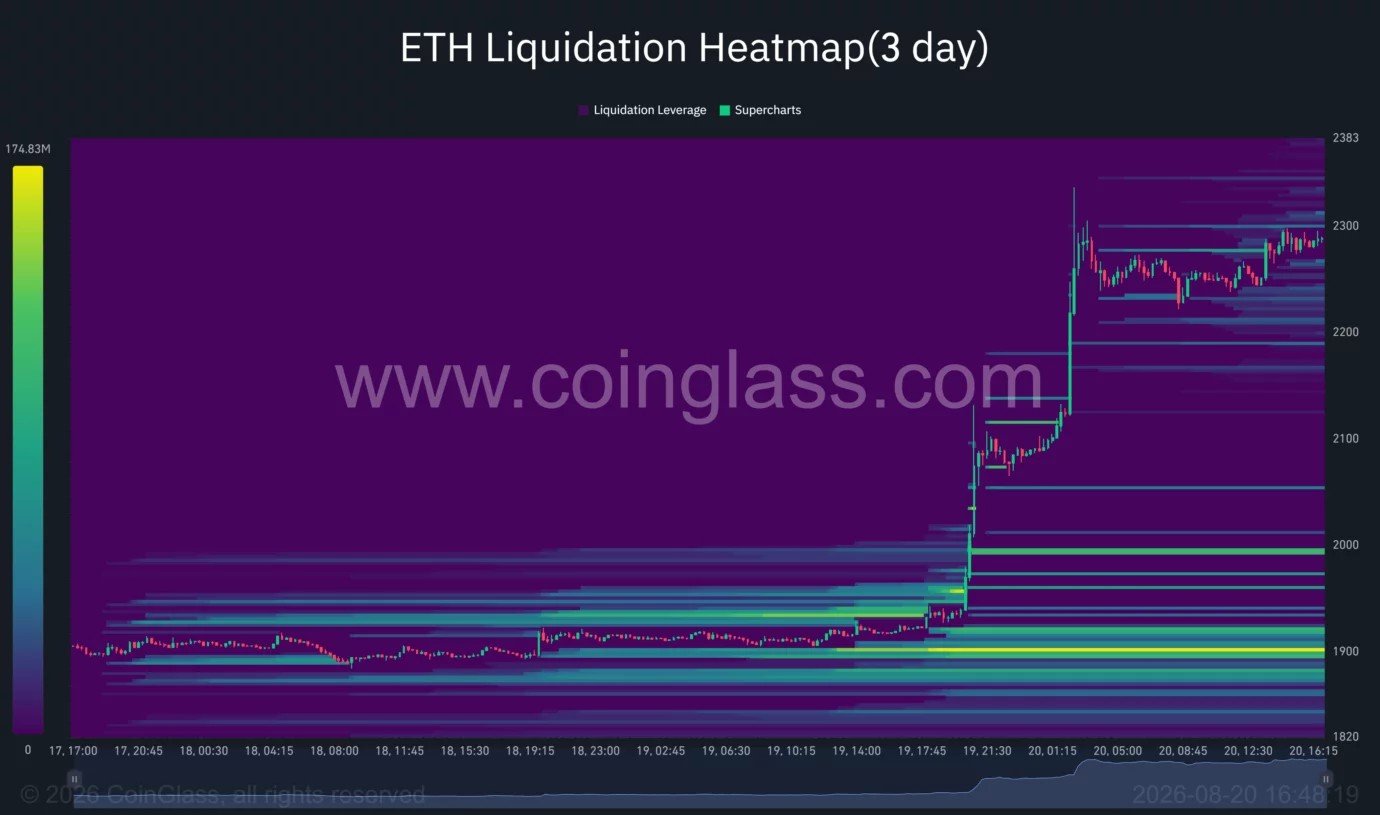
Liquidity is also building below the market. Visible clusters sit around $2,220, $2,180, and $2,100, while the largest concentration remains near $1,900.
Liquidation levels do not act as guaranteed price targets. They identify areas where leveraged positions may be forced to close, which can attract price during periods of high volatility.
Because much of the liquidity below $2,000 accumulated before the breakout, a complete return to that region would require $ETH to lose several newly reclaimed supports. The more immediate risk is a retest of $2,220 or $2,100 as traders reduce leverage and take profits.
Analysts see $2,500 as Ethereum’s next test
Crypto analyst Michaël van de Poppe said Ethereum’s move confirmed that the market was in a bullish phase, but he did not expect the asset to continue rising in a straight line.
Van de Poppe said $ETH had reached approximately 0.033 $BTC against Bitcoin and described pullbacks from the level as potential buying opportunities. His $ETH/$BTC chart showed nearby support around 0.032 and a lower zone close to 0.0305.
An absolutely amazing move of $ETH.
— Michaël van de Poppe (@CryptoMichNL) August 20, 2026
I don't think it will continue to run in one go, but it's quite clear that we're currently in a bull market.
Swept all the way towards 0.033 $BTC and very likely retraces are for buying. pic.twitter.com/Fw7ZeM10UW
Market commentator Ted Pillows identified $2,500 as Ethereum’s next resistance. He argued that reclaiming the level would reduce the likelihood of $ETH returning to a new cycle low, while a rejection would keep the lower part of the range relevant.
The two views align with the visible price structure: Ethereum has shifted from consolidation into an uptrend, but the asset is now approaching resistance with unusually extended momentum.
For U.S. investors, Treasury yields, the dollar, and spot ETF flows may determine whether the breakout develops into sustained demand. A pause near $2,300 would allow technical indicators to cool, while a high-volume close above $2,500 would provide stronger confirmation that buyers can absorb profit-taking after the short squeeze.