
Ethereum has risen roughly 3.3% over the past 24 hours to around $2,664, after briefly testing the $2,700 level as ETF inflows returned and short liquidations increased.
CoinGecko data shows $ETH has traded between approximately $2,569 and $2,701 over the past day, with the token gaining around 6% over seven days.
Buyers pushed the price above $2,600 during the move before $ETH reached an intraday high near $2,700 and pulled back towards $2,650.
US spot Ethereum exchange-traded funds recorded $143.8 million in net inflows on Sept. 18, according to SoSoValue data.
Oil prices have meanwhile eased after the surge that pressured risk assets last week.
Brent crude fell roughly 2% to $101.71 a barrel on Monday as Saudi exports recovered and markets assessed the prospect of improved oil flows from the Middle East.
Nasdaq futures rose around 0.6%, while S&P 500 futures gained 0.4%, according to Google Finance data.
The pullback followed a period in which oil traded above $100 and inflation concerns increased after the Federal Reserve raised interest rates on Sept. 16, but as crude prices fell on Monday, several risk assets moved higher despite expectations for more tightening.
$ETH's move through the $2,550 to $2,600 range has also forced traders betting on lower prices to close their positions.
Coinglass data shows over $79 million in Ethereum shorts were liquidated over 24 hours, compared with approximately $16 million in long positions.
Support has come from the rest of the crypto market as well, with Bitcoin holding above $80,000 over the weekend.
US spot Bitcoin ETFs attracted $433 million on Sept. 18, including $310.7 million for Fidelity's FBTC and $108.4 million for BlackRock's IBIT.
Bitcoin's gains have come as the House Financial Services Committee advanced the American Reserve Modernization Act on Sept. 16. H.R. 8957 seeks to establish a Strategic Bitcoin Reserve, set rules for managing Bitcoin held by the federal government and direct the Treasury to maintain secure storage for those holdings.
The bill includes provisions for acquiring more $BTC over five years through budget neutral strategies, while a similar measure has not passed the Senate.
The bill does not create a government purchase programme for Ethereum, but as its progress helped support sentiment around Bitcoin and $BTC stayed above $80,000, $ETH and several other major cryptocurrencies moved higher alongside it.
$ETH price analysis
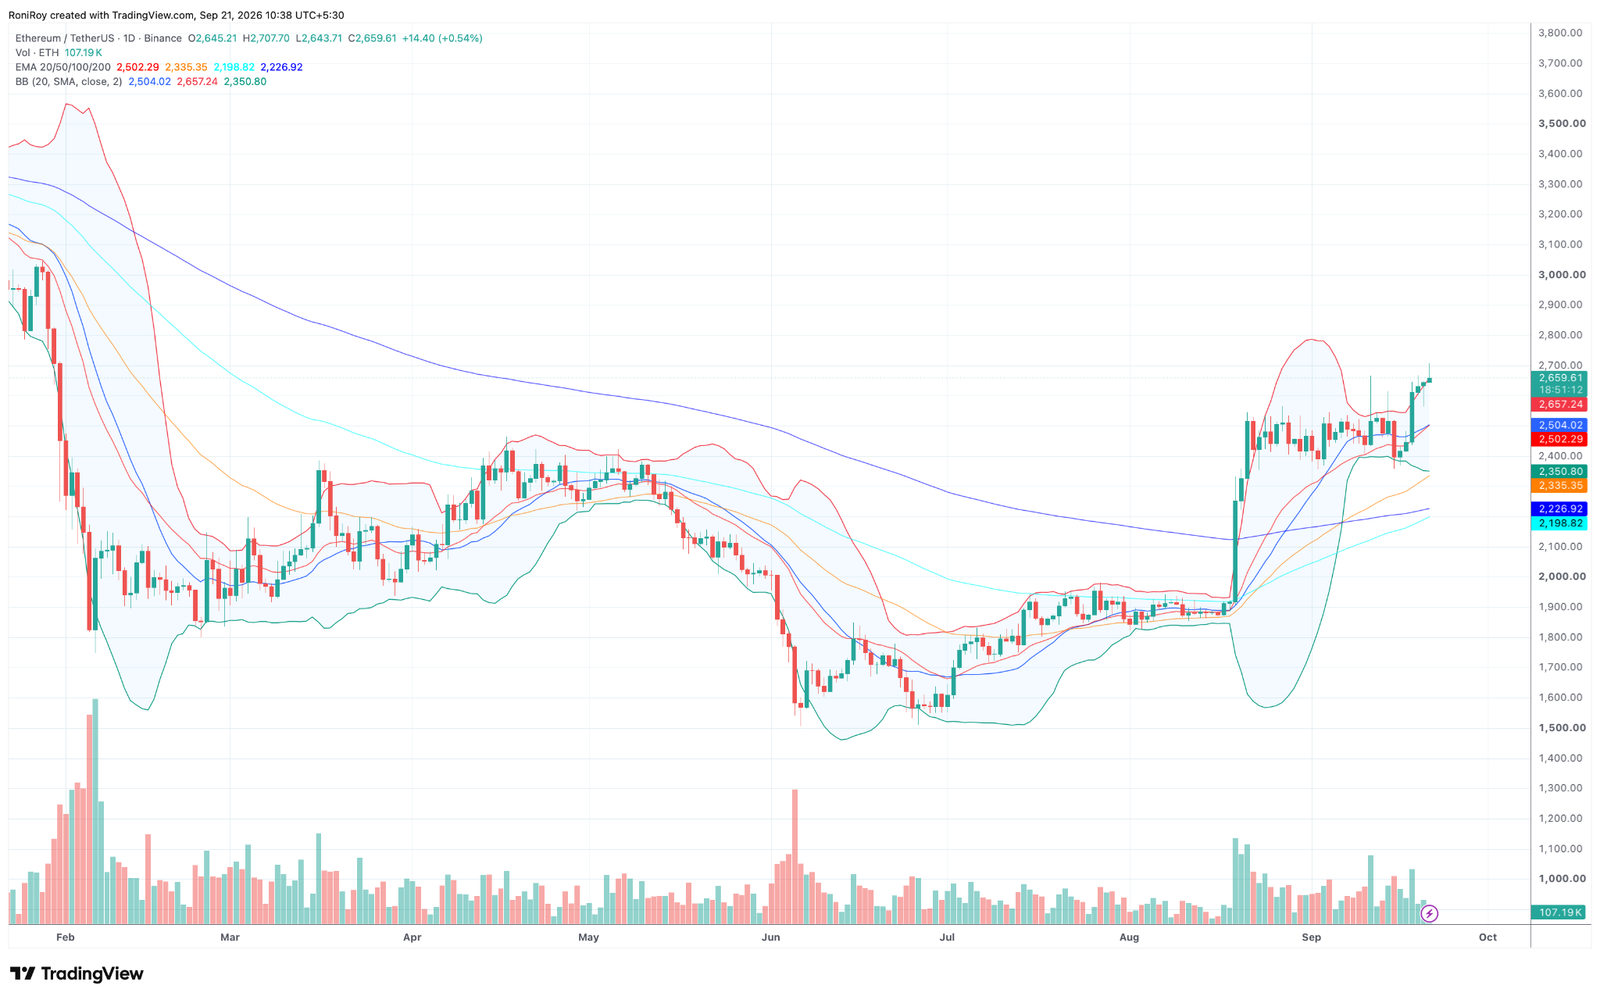
$ETH is trading around $2,659 on the daily chart after reaching $2,707.70 earlier in the session.
Price has moved above its recent consolidation range and remains well above the 20-day, 50-day, 100-day, and 200-day exponential moving averages. See below.
$ETH/$USDT 1-day price chart. Source: TradingView.
The 20-day EMA sits at $2,502.29, while the 50-day EMA is at $2,335.35.
The 100-day EMA is lower at $2,198.82, while the 200-day EMA stands at $2,226.92.
With $ETH holding above all four averages, the price is still moving upwards, while $2,500 is an important level to watch if $ETH pulls back.
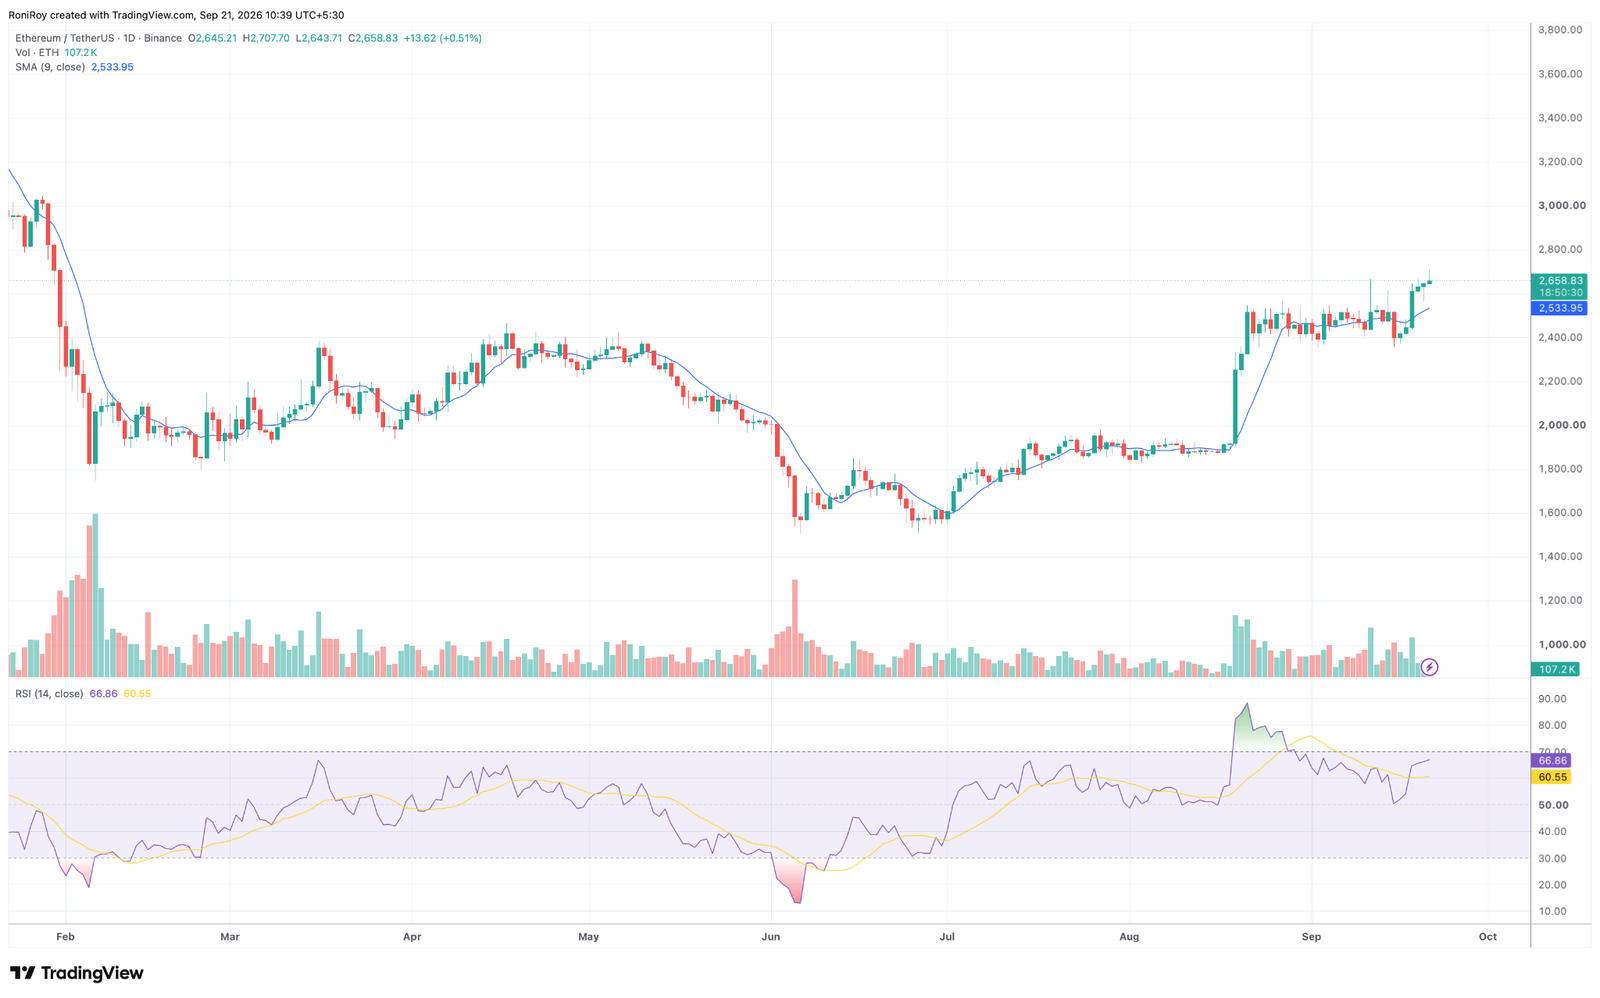
The nine-day simple moving average has risen to $2,533.95, leaving $ETH more than $120 above it.
A pullback towards $2,534 would test this moving average first before the 20-day EMA near $2,502 comes into play.
The Bollinger Bands have moved further apart as volatility has increased.
The upper band sits at $2,657.24, with $ETH trading just above it near $2,659 after briefly moving past $2,700.
If $ETH can keep closing above the upper band, $2,700 to $2,708 remains the immediate breakout area.
A clean move above $2,708 could take the price towards $2,750 and then $2,800 based on the recent price structure.
If $ETH fails to hold roughly $2,650, the nine-day SMA near $2,534 would be the first level to watch.
$ETH/$USDT 1-day price chart. Source: TradingView.
The Bollinger Band midpoint at $2,504.02 sits almost directly alongside the 20-day EMA at $2,502.29, giving $ETH another support area around $2,500.
A daily close below $2,500 could send $ETH back towards its previous consolidation area around $2,400.
Below that, the lower Bollinger Band sits at $2,350.80, followed closely by the 50-day EMA near $2,335.
RSI has climbed to 66.86 from its moving average of 60.55.
It is getting close to the conventional overbought level of 70 but has not crossed it yet, while $ETH has continued to make higher daily highs.
If $ETH breaks above $2,708 while RSI holds near or moves above 70, the price could move towards $2,750 and then $2,800.
If RSI falls below 60 while $ETH loses $2,650, the price could retest the area between the nine day SMA at $2,534 and the support around $2,500.
At current levels, the price action favours a move towards $2,750 to $2,800, although the rising RSI leaves less room for $ETH to climb before entering overbought territory.