
Dogecoin is sitting at a long-term support area while also pressing against a short-term breakout level. Together, the two charts suggest $DOGE may be close to a larger move, but the direction still depends on whether key support holds.
Dogecoin Tests Repeat Buy Setup on Two-Week Chart
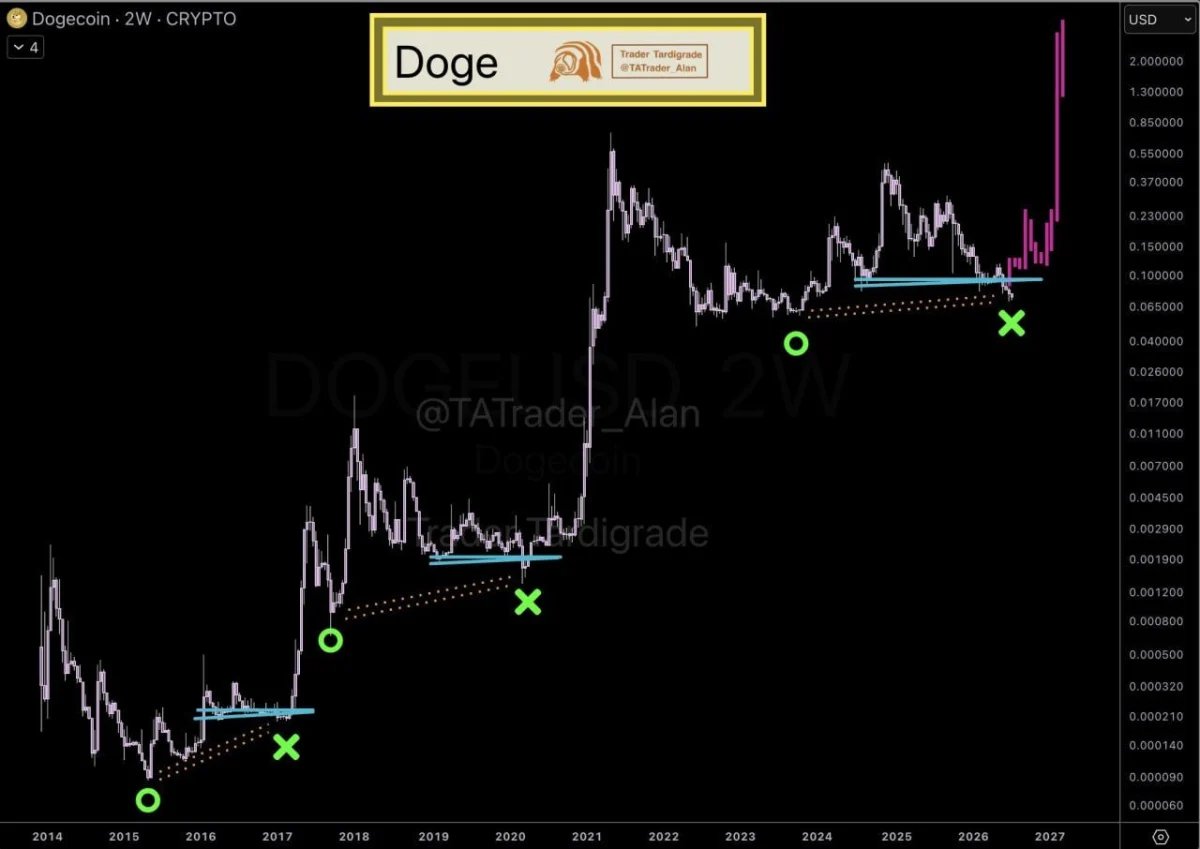
Dogecoin is back at a technical zone that previously appeared before strong upside moves, according to a two-week chart shared by Trader Tardigrade.
$DOGE chart . Source: Trader Tardigrade/X
The chart shows a recurring structure built around two signals, marked “O” and “X.” In earlier cycles, both zones appeared near support before Dogecoin moved higher. The current setup places $DOGE at another “X” area, which the analyst views as a favorable entry zone.
The main takeaway is that Dogecoin is again testing a familiar support region within a broader rising structure. If that level holds, the pattern suggests the meme coin could attempt another leg higher.
Still, the setup remains conditional. A breakdown below the marked support zone would weaken the bullish case and reduce the chance of a repeat of past cycles.
Dogecoin Nears Breakout Point on 4-Hour Chart
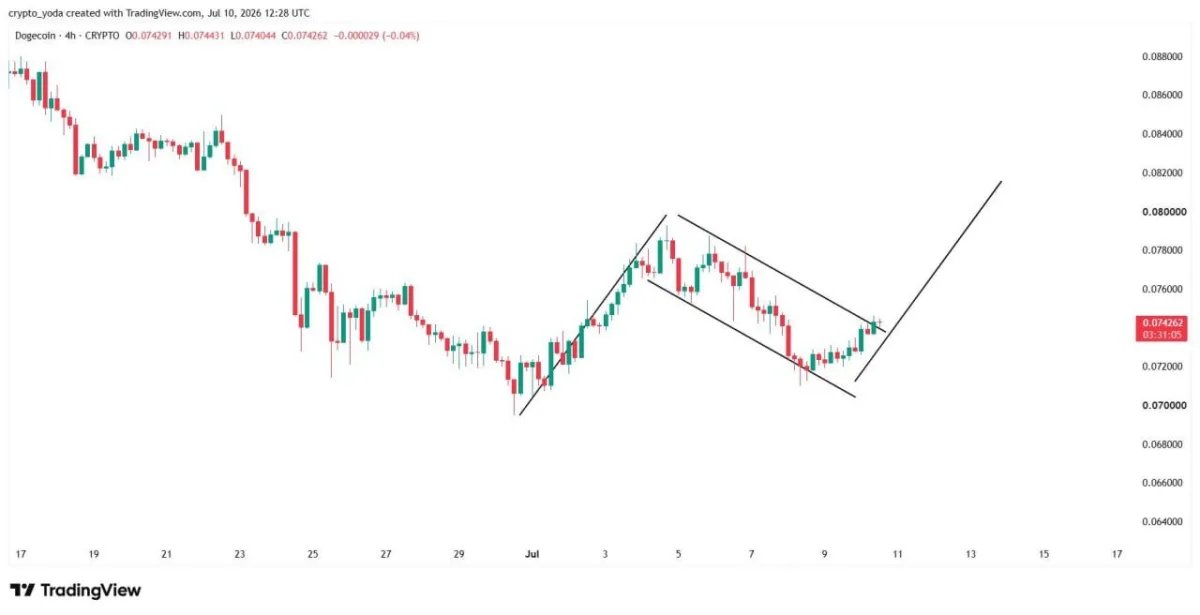
Dogecoin is approaching a key decision area on the four-hour chart as price tightens after moving inside a falling channel, according to analyst Crypto Yoda.
$DOGE four-hour chart. Source: Crypto Yoda/X
The chart shows $DOGE rebounding from the lower boundary of the channel and starting to push higher. Price is now moving toward the upper trendline, where a breakout could confirm a stronger bullish move.
Crypto Yoda said Dogecoin is “running out of room,” suggesting the current squeeze may soon lead to a sharp move. If $DOGE breaks above the channel, the setup points to further upside.
Still, the move is not confirmed yet. A rejection at resistance would keep $DOGE inside the channel and delay any breakout.