
Dogecoin still looks weak against $USDT while it trades below its downtrend, keeping the $0.047 liquidity zone in focus. However, the $DOGE/$ETH chart is testing long-term relative support, which could decide whether $DOGE starts outperforming Ethereum again or keeps lagging.
Dogecoin Downtrend Keeps $0.047 Liquidity Target in Focus
Dogecoin remains under pressure on the higher-timeframe chart as price continues to make lower highs and lower lows. Unless $DOGE breaks back above $0.11 with strength, one trader says the next high-probability area to watch sits near $0.047.
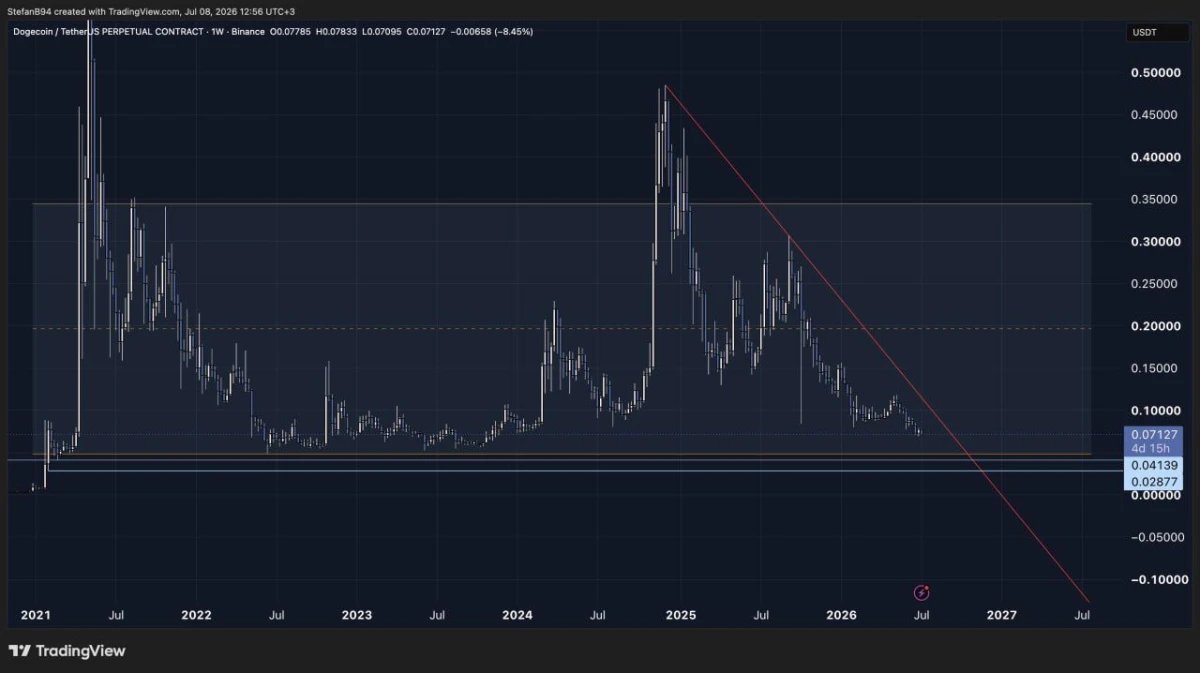
$DOGE/$USDT weekly chart. Source: Stefan on X, TradingView
The chart shows $DOGE still trading below a long-term descending trendline that has capped price since the previous major high.
According to Stefan, the setup does not support aggressive bullish targets yet. He said $DOGE is still grinding lower on the wrong side of the trendline, which keeps liquidity below in focus.
The main downside area on the chart sits near $0.047. That level is marked as an equal-lows zone and could become the next major pivot if price continues lower.
Below that, the chart also shows deeper historical levels near $0.041 and $0.028. These areas could matter if $DOGE fails to hold the first liquidity target.
However, the bearish view has a clear invalidation level. Stefan said $DOGE would need to break above $0.11 with strength to weaken the downside setup.
For now, the chart remains cautious. Until $DOGE reclaims the trendline and breaks higher resistance, the $0.047 liquidity zone stays in focus.
$DOGE/$ETH Chart Shows Dogecoin Near Key Relative Support
Dogecoin is sitting near a long-term support zone against Ethereum, making the $DOGE/$ETH pair important for traders comparing both assets. If $DOGE holds this area, it could start outperforming $ETH again, but losing support would keep Ethereum in control.
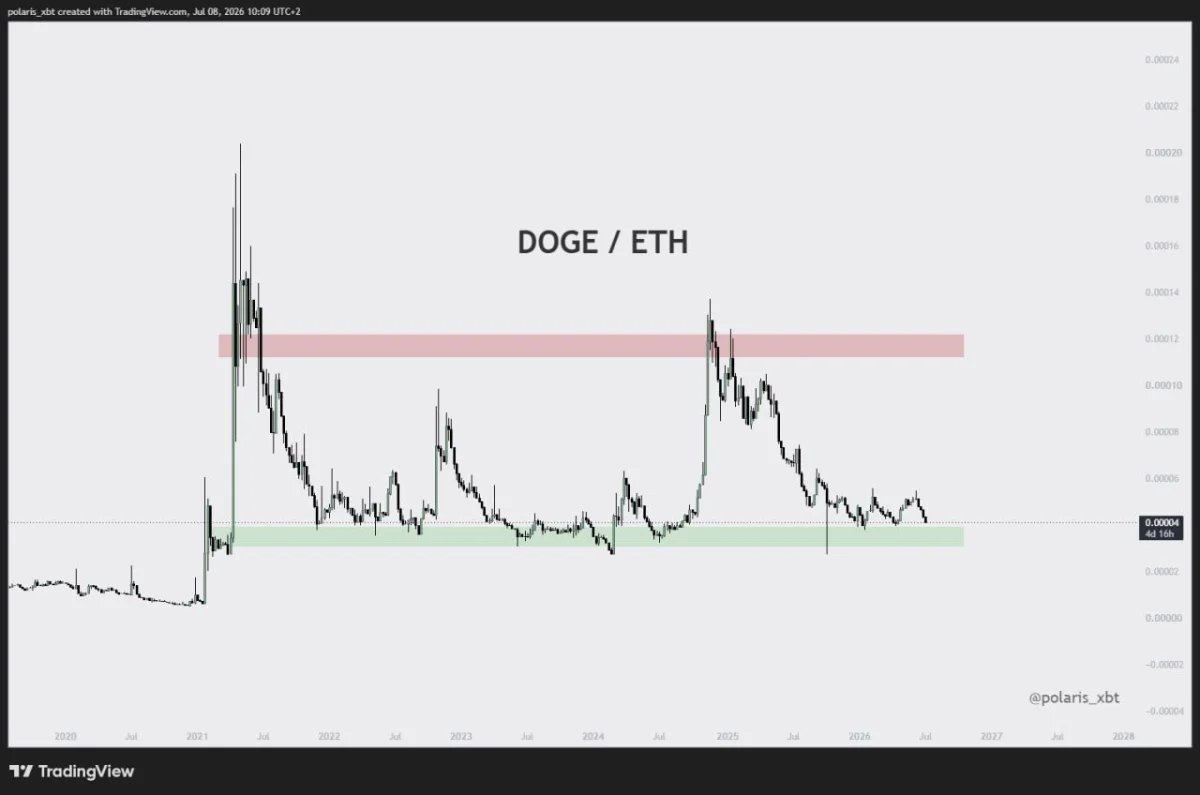
$DOGE/$ETH chart. Source: polaris_xbt on X, TradingView
The chart shows $DOGE/$ETH moving between two major long-term zones. The lower green zone has acted as support several times, while the upper red zone has marked major resistance during previous $DOGE outperformance cycles.
That makes the current area important. $DOGE is trading close to the lower support band, where past reactions have started before stronger moves against $ETH.
According to polaris_xbt, this chart can help traders decide what to hold and when. In simple terms, it tracks whether Dogecoin is gaining or losing strength compared with Ethereum.
If $DOGE/$ETH holds the green support area, Dogecoin could begin a new relative-strength move against $ETH. That would suggest $DOGE may outperform Ethereum during the next rotation.
However, if the pair breaks below support, $ETH would remain the stronger asset, and $DOGE could continue underperforming.
The upper red zone remains the bigger target if $DOGE starts gaining strength again. A move toward that area would show a major rotation back into Dogecoin relative to Ethereum.
For now, the support zone is the key signal. Holding it keeps the $DOGE outperforming $ETH setup alive, while losing it would favor Ethereum.