
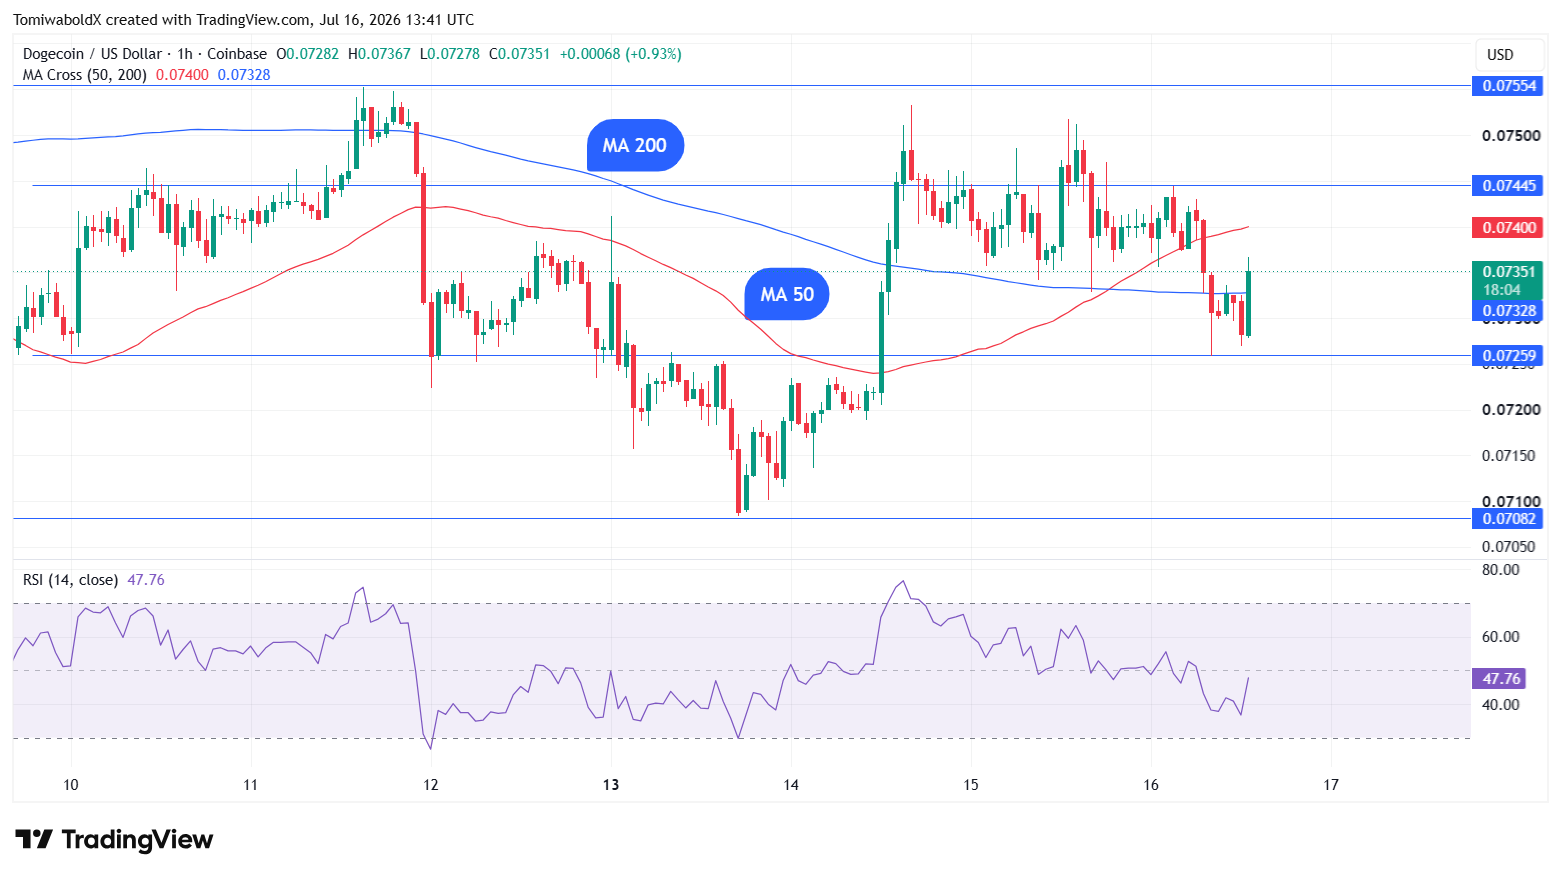
Dogecoin has completed a golden cross on its hourly charts, but the timing of the formation has traders watching closely for what comes next.
The MA 50 rose above the MA 200 on the hourly chart, completing a golden cross. This signal comes as the market faces fresh selling pressure, with Dogecoin itself trading in the red on a daily basis.
The crypto market extended selling on Thursday, after Bitcoin rose to a monthly high of $65,500 on Wednesday, prompting some traders to take profits. On Thursday, investors will be monitoring retail sales data and jobless claims for further signs on the health of the economy.
Two levels in focus
Dogecoin sharply rose to $0.075 on Tuesday, but has since retreated. At the time of writing, $DOGE was down 1.45% in the last 24 hours to $0.072 and up 0.62% weekly, according to CoinMarketCap.
The RSI stays below 50 on most timeframes; on the hourly chart, the RSI is at 37, a negative level which suggests a slight advantage to the bears.
With the market flashing mixed signals, Dogecoin price might trend in either direction. Two levels come into focus: the resistance at $0.081 and the support at $0.069.
CoinMarketCap's "Altcoin Season" indicator remains range-bound, currently at 48/100 after dropping from 58/100 on Monday as investors moved focus back to Bitcoin.
Traders are watching out for a potential death cross on the weekly chart, which is set to appear in the coming weeks. The last weekly death cross appeared in February 2023, with traders now watching for a potential repeat of history.
In recent news, the Dogecoin Foundation's official corporate arm, House of Doge, has announced its Board of Directors. This includes leaders in institutional asset management, global consumer operations, and the digital asset industry.