
Bitcoin [$BTC] is once again closing in on $80k after dropping from that price threshold for a few days. At press time $BTC was changing hands at $79,031.27 after a hike of 1.9% in the past 24 hours.
However, though the price action looks promising, the underlying structure of Bitcoin’s demand is stirring the pot.
Something is not right, though
According to CryptoQuant’s data, Bitcoin’s market structure may be shifting from a spot-driven phase toward a futures- and leverage-driven phase.
Connecting the dots from the past, this usually happens around the early stages of a strong bull market. However, in no sense does this mean that investors are selling Bitcoin.
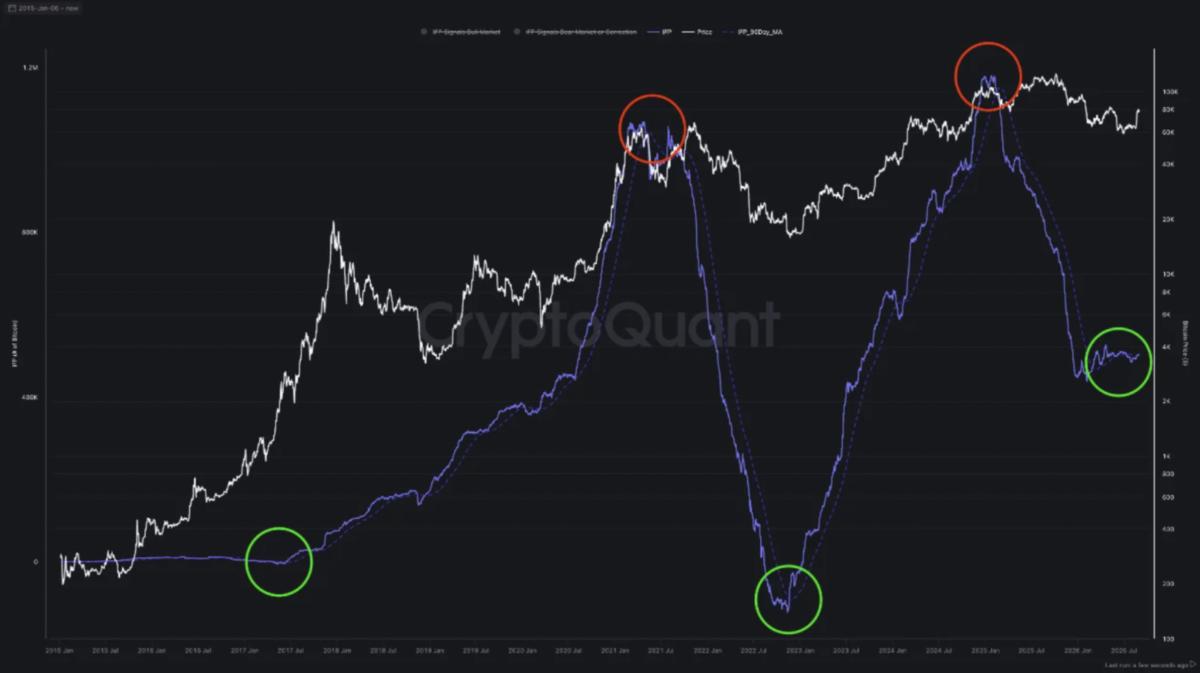
Rather, they are preparing to use Bitcoin as collateral or to establish leveraged futures positions. In other words, if traders increasingly position themselves on the long side, leverage can amplify buying pressure and potentially accelerate a price rally.
Hence, CryptoQuant’s analysis quoted this period best when they noted,
#$BTC The dawn of a new cycle is breaking
What is an underlying fear?
However, now since September has officially begun, there is an unsaid FUD (fear, uncertainty, and doubt) in the crypto community.
Various analysts are analyzing whether September 2026 would be different from previous years or it would once again exhibit a red month.
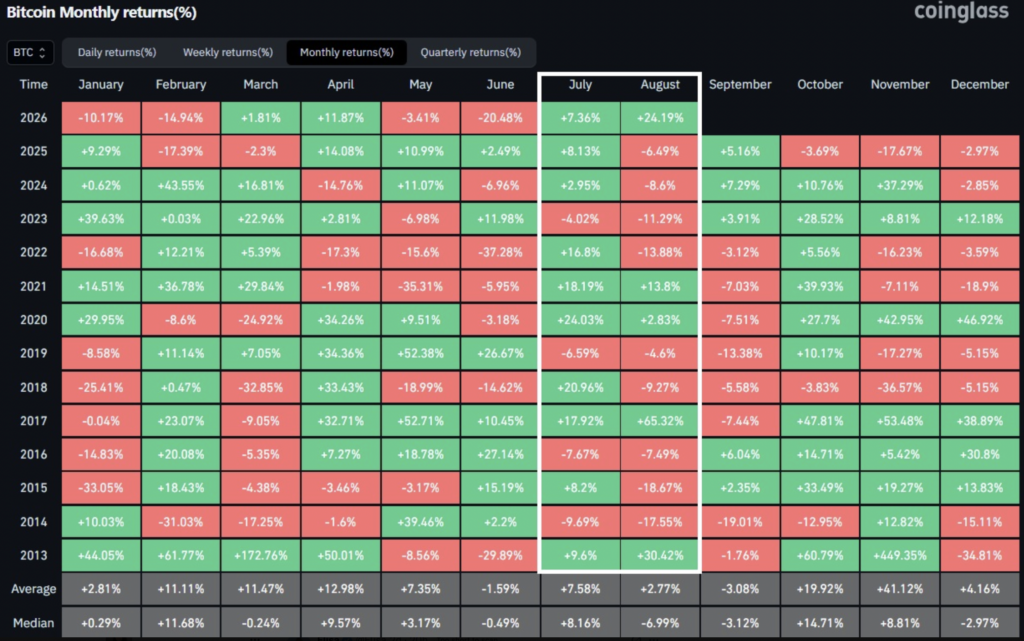
For instance, back in 2021, July was up by 18.19% and August up by 13.80%.
However, September recorded a decline of 7.03%. A similar pattern was seen in 2020, when in July there was a 24.03% surge and August witnessed a hike of just 2.83%. This in turn led to September dropping by 7.51%.
Why could September 2026 be different from previous years?
This is particularly notable because July 2026 moved up by 7.36% and August was roughly higher by 24.19%, meaning both months closed strongly positive, creating the same setup.
Yet, the current pattern is not strong enough by itself to conclude that Bitcoin must fall in September 2026.
In AMBCrypto’s words, Bitcoin’s September weakness was especially noticeable between 2017 and 2022, as the cryptocurrency recorded six straight September returns that were negative.
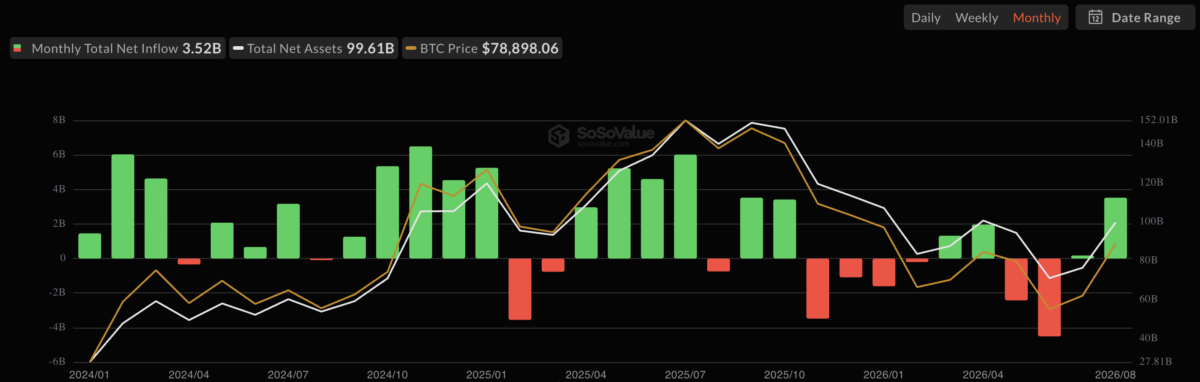
After that, though, the pattern significantly weakened, with September closes in 2023, 2024, and 2025 showing positive results. In fact, with Bitcoin ETFs recording monthly inflows worth $172.43 million in July 2026 and $3.52 billion in August 2026, hope remains.
What to expect?
Additionally, the Bitcoin’s Bull Score has also jumped from 30 to 80, recording the fastest improvement in a year. This suggests that the market’s underlying momentum has changed unusually quickly.
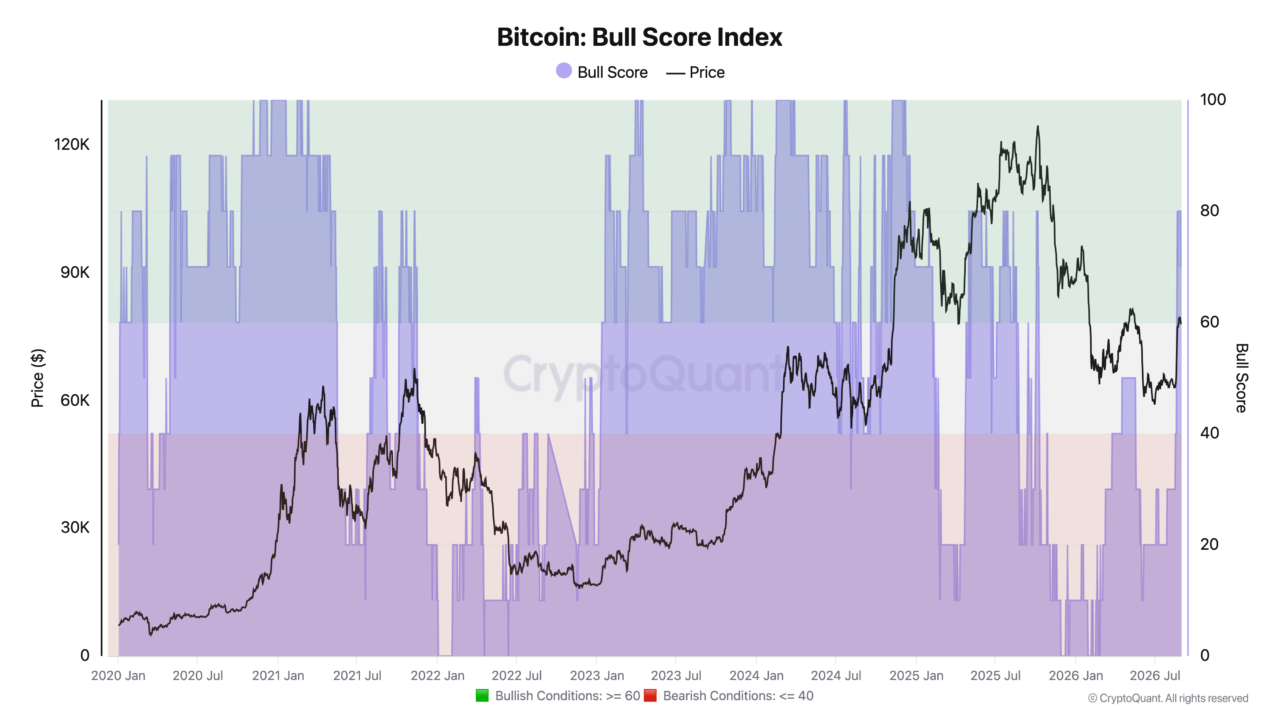
Meanwhile, the PnL Index moving above its 365-day moving average is another encouraging signal because it indicates that Bitcoin holders’ profitability and market conditions are improving relative to the long-term trend.
This is very similar to what happened during the 2023 market recovery.
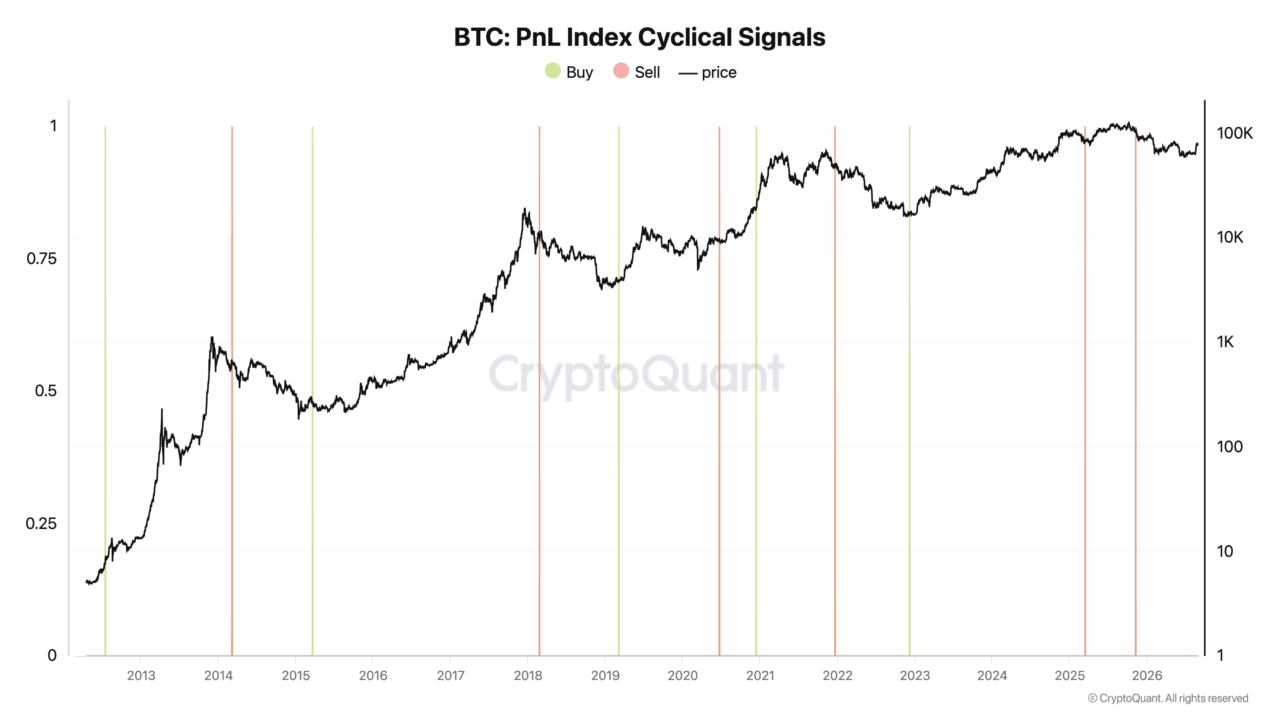
All in all, the market is showing signs that the bear cycle may be ending, but $83,000 is the line that could help define a genuine new bullish phase. Nevertheless, failure to reclaim it could lead to consolidation or another downside retest.
Final Summary
- Bitcoin’s market structure is shifting from a spot-driven to a futures- and leverage-driven phase.
- Bitcoin’s Bull Score has jumped from 30 to 80 as $BTC’s price is proceeding towards $80K.